

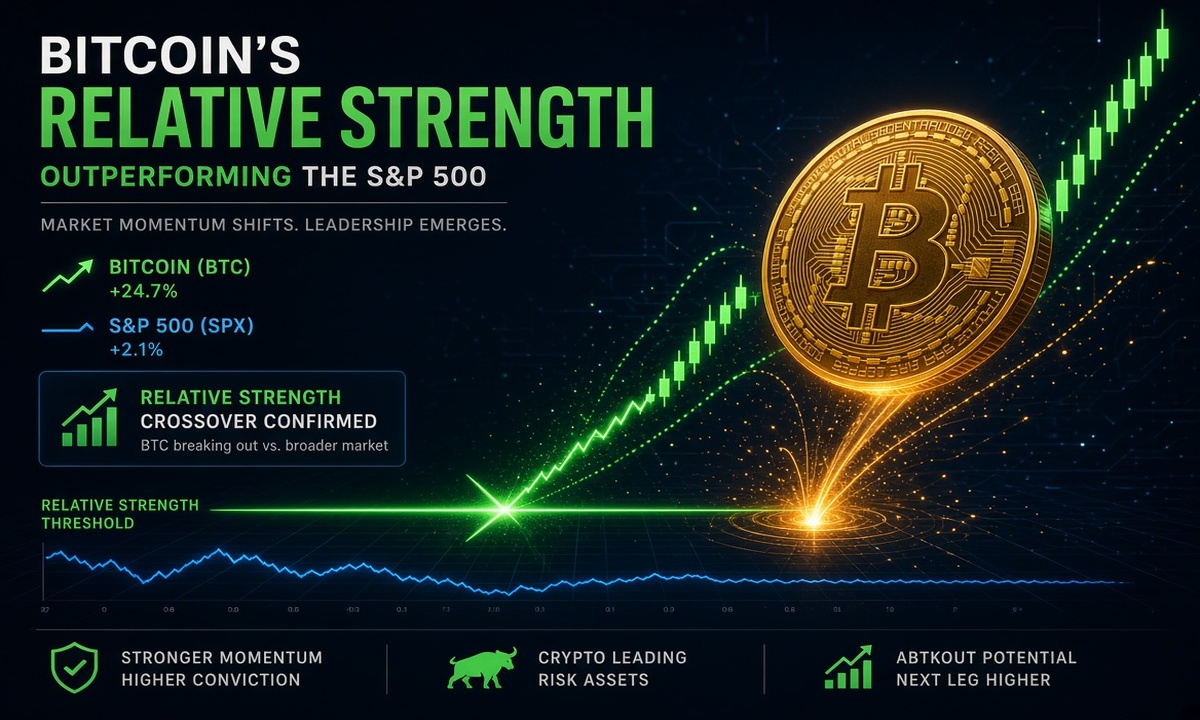
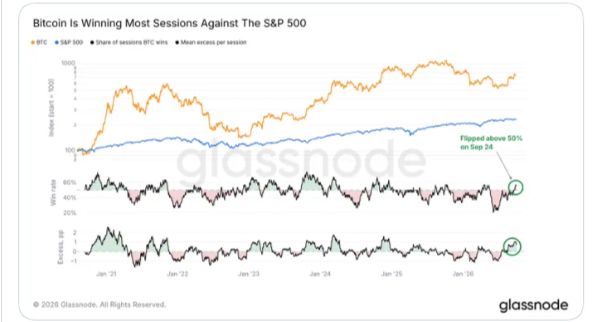
Glassnode’s latest chart tells a quiet but important story about the current state of Bitcoin relative strength.
Bitcoin relative strength has climbed back above the 50% mark against the S&P 500.
In June 2026, the same metric sat at its weakest reading in six (6) years, with Bitcoin beating the equity index on only one in five trading days.
Due to the huge liquidity that continues to be poured into the largest digital asset in terms of market capitalisation, that stretch has ended.

What Does Bitcoin Relative Strength Actually Measure?
The metric tracks how often Bitcoin finishes a trading session ahead of the S&P 500 over a rolling window.
Anything above 50% means Bitcoin is winning more days than it loses. When the reading falls well below that line, equity markets usually set the broader risk tone.
Crossing back above 50% signals that Bitcoin is once again generating its own independent demand.
In June 2026, the win rate sank to roughly 20%. By late September 2026, the figure had recovered past the midpoint while the S&P 500 itself stayed essentially flat.
That combination points to an idiosyncratic bid rather than a simple rising-tide effect.
Why Did Bitcoin Relative Strength Sink So Low Earlier This Year?
Throughout the first half of 2026, equities led the tape. Bitcoin lagged for months, posting its longest underperformance streak against the S&P 500 in six years of recorded history.
Macro narratives favoured traditional risk assets, and crypto correlation with stocks remained elevated.
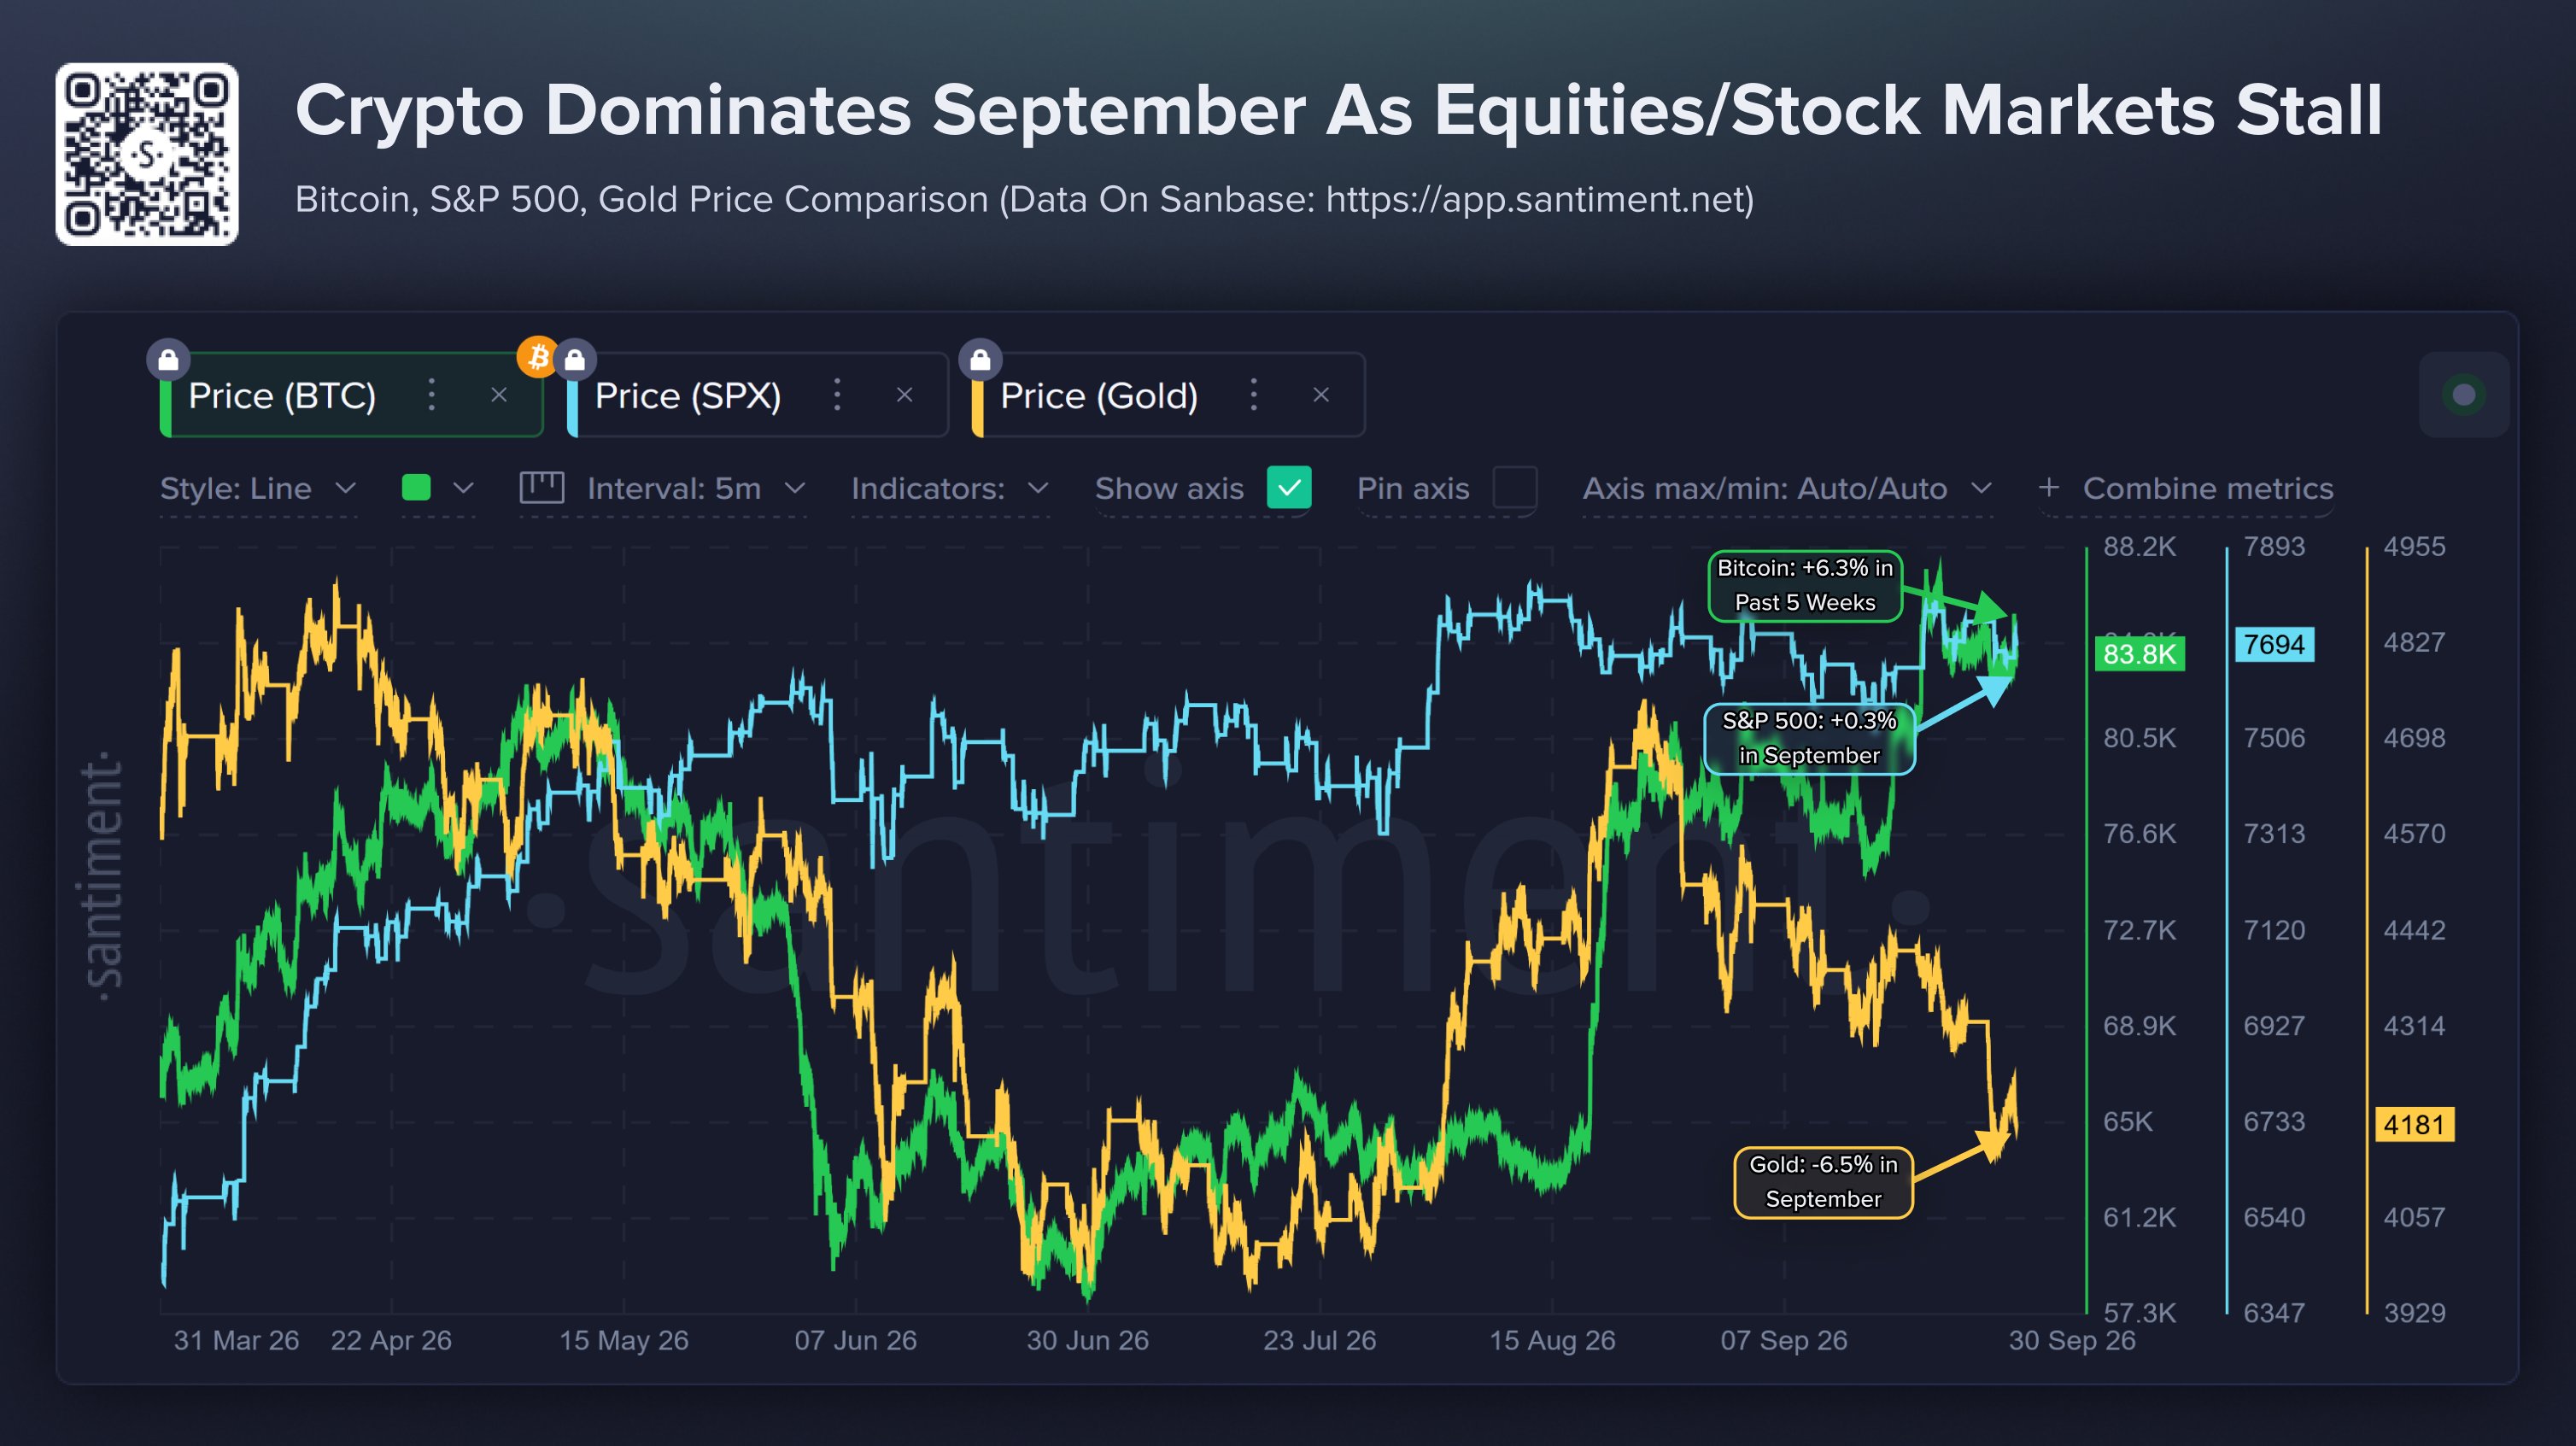
After that prolonged soft patch, the picture flipped. September 2026 delivered roughly 7% gains for Bitcoin while the S&P 500 moved between 0 and 0.3%. Gold, by contrast, lost more than 6% over the same stretch.
Since the mid-August 2026 low, Bitcoin’s market capitalisation has risen approximately 36% against an 0.8% advance for the equity index.
How Does the Current Bitcoin Relative Strength Shift Change Market Dynamics?
A sustained reading above 50% reduces the market’s dependence on equity momentum. Traders no longer need the S&P 500 to rise in order for Bitcoin to advance.
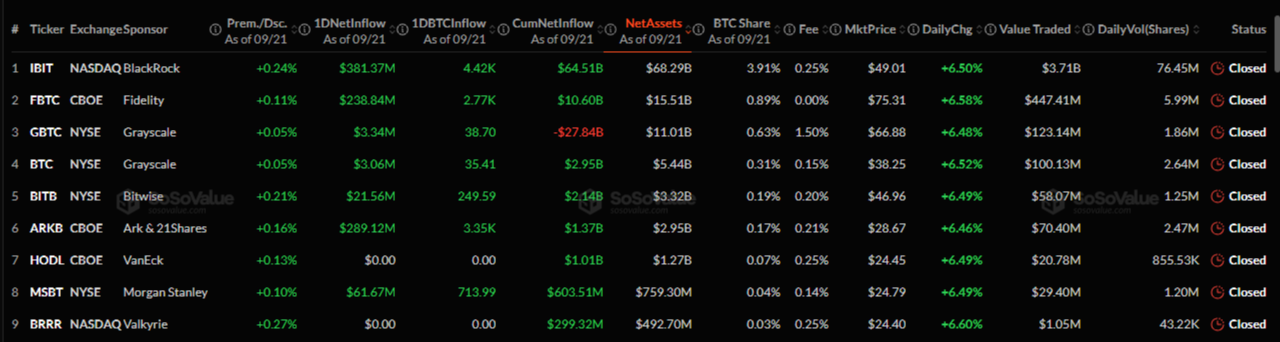
The asset begins to attract capital on its own merits—whether from exchange-traded fund (ETF) flows, on-chain accumulation, or simply a renewed preference for digital scarcity.
Building on that independence, correlation metrics have also eased. Some analytics desks now report multi-year lows in Bitcoin’s rolling correlation with the S&P 500. That decoupling gives portfolio managers a clearer diversifier again.
Moreover, the rebound arrives while open interest remains relatively restrained, limiting the risk of leveraged flushes that often accompany pure risk-on moves.
What Should Traders Watch?
Continued session-by-session outperformance remains the first checkpoint. A string of additional weeks above the 50% threshold would strengthen the case.
Parallel improvements in spot demand, ETF net inflows, and long-term holder behaviour would add conviction.
At the same time, any sharp reversal in equity markets could still test the newly recovered strength.
Watching the interaction between Bitcoin and the broader risk complex will show whether the idiosyncratic bid is durable or temporary.
Glassnode’s data frames the current moment clearly. Bitcoin relative strength has reclaimed the key midpoint after its weakest stretch in six years, and it has done so while stocks themselves stayed quiet.
That combination points to genuine, asset-specific demand returning to Bitcoin—an early but meaningful shift in the market’s leadership.
