

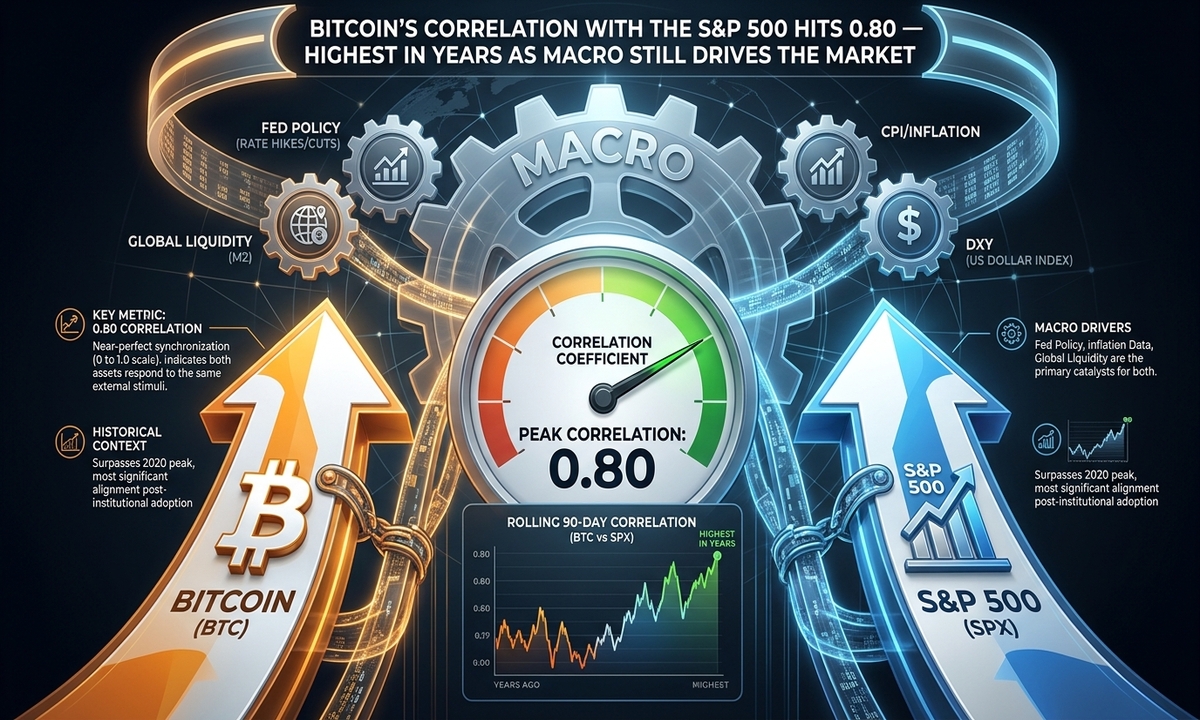
Bitcoin daily price moves have locked onto the S&P 500 with unusual tightness.
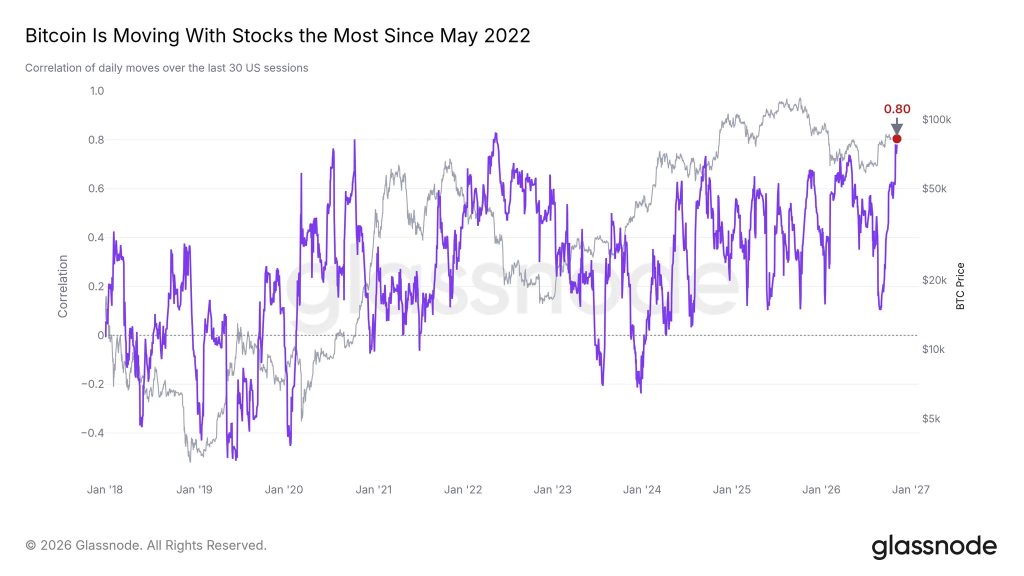
Over the last 30 U.S. trading sessions the correlation coefficient climbed to 0.80, a level rarely seen since 2020 and the strongest reading in years according to Glassnode data.
The chart from the analytics firm shows Bitcoin’s rolling 30-session correlation with equities spiking higher while the asset itself traded near the mid-$70,000s.
Most of the post-2020 period saw far lower readings, often well below 0.5. Right now the two markets are moving almost in lockstep.
What Does a 0.80 Correlation Between Bitcoin and the S&P 500 Actually Mean?
A reading of 0.80 signals that roughly 64% of BTC’s daily variance can be explained by the same forces moving large-cap U.S. stocks.
In practical terms, when the S&P 500 rises or falls on a given session, Bitcoin tends to follow in the same direction with high consistency.
Investors watching both assets notice the tandem swings almost immediately.

Why Is Bitcoin Tracking Stocks So Closely Right Now?
Macro forces dominate price discovery at the moment. Interest-rate expectations, liquidity conditions, and risk appetite across traditional markets set the tone.
Institutional ownership through spot ETFs (exchange-traded funds) has pulled Bitcoin deeper into the same portfolios that hold equities.
When those managers reduce risk, both assets feel the pressure at once. Shared leverage and margin requirements amplify the effect further.

Does This High Correlation Mean Bitcoin No Longer Acts as a Diversifier?
In the short window measured by Glassnode, the diversification benefit has clearly weakened.
Portfolio managers who once counted on low or negative correlation for risk reduction find far less protection today.
Longer-term windows still show milder readings—around 0.4 to 0.5 over one year—yet the recent spike warns that the hedge can vanish precisely when markets turn volatile.

How Does Macro Still Drive Bitcoin’s Direction Despite Talk of Relative Strength?
Narratives about Bitcoin’s unique strength surface regularly, yet the data tell a different story.
Liquidity conditions, Federal Reserve policy signals, and broader risk sentiment continue to dictate the path.
Even periods of relative outperformance fade once equities shift. Glassnode’s note puts it plainly: macro sets the direction for now.
Will the Elevated Correlation Persist?
History shows these spikes rarely last indefinitely. Earlier episodes of tight linkage eventually eased as liquidity improved or risk appetite rotated.
Looking ahead, a sustained easing in financial conditions or a clear shift in monetary policy could loosen the tie again.
Until then, traders treat Bitcoin as another high-beta risk asset rather than an independent store of value.
The current 0.80 reading shows a simple reality. Bitcoin remains highly sensitive to the same macro currents that move the S&P 500.
Investors who ignore that linkage risk misjudging both downside exposure and the true nature of recent price action.
