


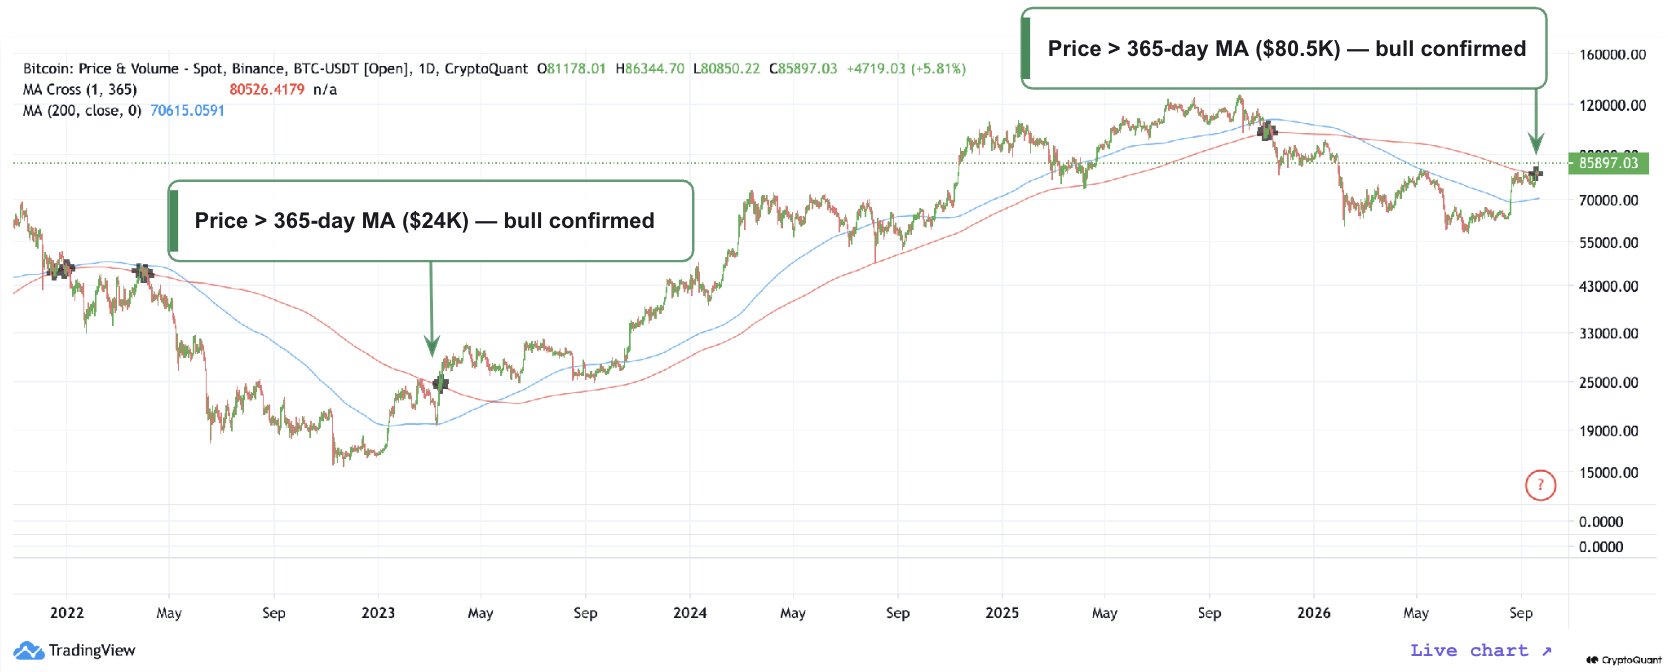
Bitcoin Bull Market status received fresh confirmation this week after the price closed above its 365-day moving average for the first time since March 2023.
CryptoQuant data shows this long-term average has correctly identified every sustained bull phase since 2019.
The latest close places Bitcoin near $86,000 while the 365-day line sits around $80,500.
Why Does the 365-Day Moving Average Matter for the Bitcoin Bull Market?
The 365-day moving average tracks the average closing price over a full year.
When Bitcoin moves and holds above that line, historical patterns point toward extended upward trends rather than short-lived rallies.
In early 2023, the same signal appeared near $24,000 and preceded a multi-year advance.
The current reclaim of the level, therefore carries weight among analysts who follow long-term technical structure.
How Reliable Has This Signal Been in Past Bitcoin Bull Market Cycles?
Since 2019, the 365-day average has marked the transition from bear or sideways conditions into sustained bull markets with notable consistency.
Each prior cross above the line was followed by higher prices over subsequent months.
The March 2023 instance remains the most recent successful example before the current one.
Traders and investors must watch whether the latest confirmation produces a similar trajectory.

What Comes Next After This Confirmation?
CryptoQuant identifies the next notable resistance zone between $88,000 and $90,000.
On-chain metrics had already pointed toward improving conditions in mid-August when Bitcoin cleared a significant supply wall.
The combination of the technical reclaim and earlier on-chain signals creates a constructive setup.
Price action in the coming weeks will test whether buyers can push through the $88K–$90K band.

Does Closing Above the 365-Day MA Guarantee a Long Bitcoin Bull Market?
No single indicator removes all risk. The 365-day average has a strong track record, yet external factors such as macroeconomic shifts or sudden liquidity changes can still interrupt trends.
Traders often combine this signal with on-chain data, funding rates, and broader market sentiment.
The current reading simply raises the probability of continued strength rather than offering certainty.

How Should Investors Interpret the Current Signal?
The reclaim of the 365-day moving average arrives after months of range-bound trading and supply absorption.
Bitcoin has now moved from a position below the long-term average into one above it.
Historical precedent favours further upside once this condition holds, yet disciplined position sizing remains essential.
Observers will monitor both price behaviour around $88K–$90K and any renewed selling pressure that could challenge the newly established level.
Bitcoin Bull Market conditions appear confirmed by the first weekly close above the 365-day moving average since March 2023.
The same technical marker that flagged earlier bull phases has once again turned constructive.
With resistance near $88,000–$90,000 now in focus and supporting on-chain evidence already in place, the market enters a new phase of heightened attention.
