

Uniswap DEX volume activity continue to outline competitor decentralised exchanges.
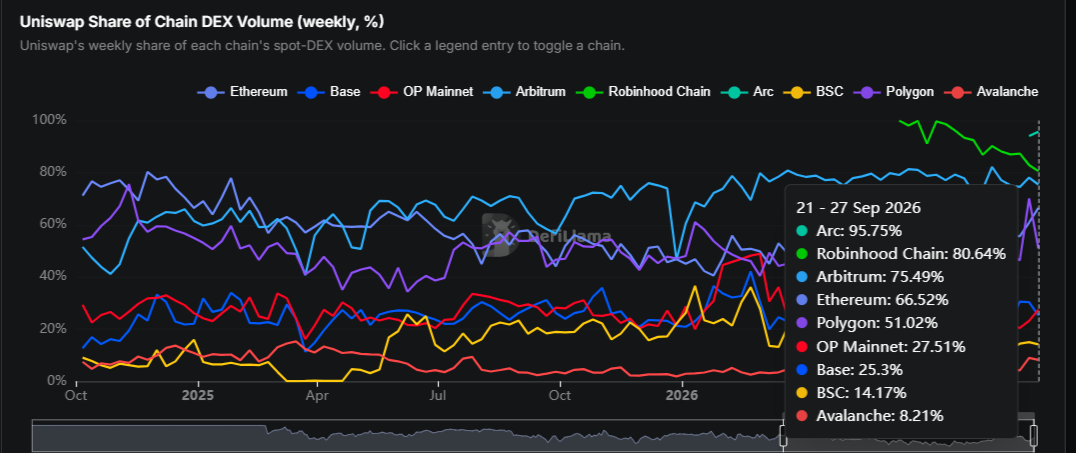
Fresh data from DefiLlama shows the protocol’s weekly share of each chain’s spot DEX volume swinging from just 8% on Avalanche all the way up to nearly 96% on Arc.
That spread, captured for the week of September 21–27, sits on the new Uniswap deep-dive dashboard and paints a vivid picture of how differently the same protocol behaves once it lands on different networks.
The chart tracks Uniswap’s percentage of total spot-DEX volume on each chain, and the contrast jumps out immediately.
On some networks, Uniswap acts almost like the default venue. On others, it fights for every trade against aggressive local competitors.
Why Does Uniswap DEX Volume Share Differ So Much Between Chains?
Chain age and local competition set the stage. Newer networks such as Arc and Robinhood Chain still lack deep native alternatives, so Uniswap quickly becomes the main liquidity hub.
Meanwhile, older chains like Avalanche and BSC already host mature local DEXs that keep a large slice of the flow.
User habits also play a crucial role. Traders who first arrive through a particular wallet or launchpad often stick with the interface they already know, which can lock in or lock out Uniswap depending on the ecosystem. Liquidity depth matters too.
When Uniswap pools on a given chain offer tighter spreads and deeper books, volume concentrates there.
When local venues match or beat those conditions, the share shrinks.

Which Chains Show the Highest Uniswap DEX Volume Share Right Now?
Arc leads the pack at 95.75% for the latest weekly window. Robinhood Chain follows closely at 80.64%, while Arbitrum holds 75.49% and Ethereum sits at 66.52%.
These high-share chains tend to feature either very recent launches or strong Uniswap integrations that make the protocol the path of least resistance for most swaps.
Polygon lands in the middle at 51.02%, showing a more balanced market where Uniswap competes but does not dominate outright.
The pattern suggests that once a chain matures and multiple strong venues appear, Uniswap’s share settles into a more contested range.
What Explains the Lower Uniswap DEX Volume Shares on Some Networks?
Avalanche sits at the bottom of the displayed range with just 8.21%. BSC follows at 14.17%, Base at 25.3%, and OP Mainnet at 27.51%.
These networks host well-established native DEXs that capture the bulk of local trading.
On Avalanche, for example, long-running local venues continue to attract the majority of volume even though Uniswap remains fully deployed.
Similar dynamics play out on BSC, where familiar interfaces and incentive programs keep traders inside local ecosystems.
Lower shares do not always signal weakness. They often reflect healthy competition that benefits users through tighter spreads and more options.
How Should Traders and Liquidity Providers Read These Figures?
Traders gain a clear signal about where Uniswap currently offers the deepest and most active markets.
High-share chains often deliver better execution simply because more of the volume already flows through those pools. Liquidity providers, on the other hand, can use the same numbers to decide where their capital is most likely to earn fees.
Deploying on a 95% share chain means competing mainly inside Uniswap itself, while a lower-share chain may require competing against local rivals for the same trades.
The data also highlights that Uniswap’s overall strength does not translate into uniform dominance.
Protocol teams launching on new chains can study these patterns to decide whether to prioritise Uniswap integrations or to cultivate local alternatives early.
Looking ahead, the wide range from 8% to 95% will likely keep shifting as new venues launch, incentives change, and user habits evolve.
DefiLlama’s ongoing dashboard gives anyone a live window into those swings, making the variation itself one of the more useful signals in DeFi right now.
