


BlackRock’s iShares Bitcoin Trust (IBIT) holds the clear lead in Bitcoin ETF (exchange-traded fund) inflows among the United States (U.S.) spot products.
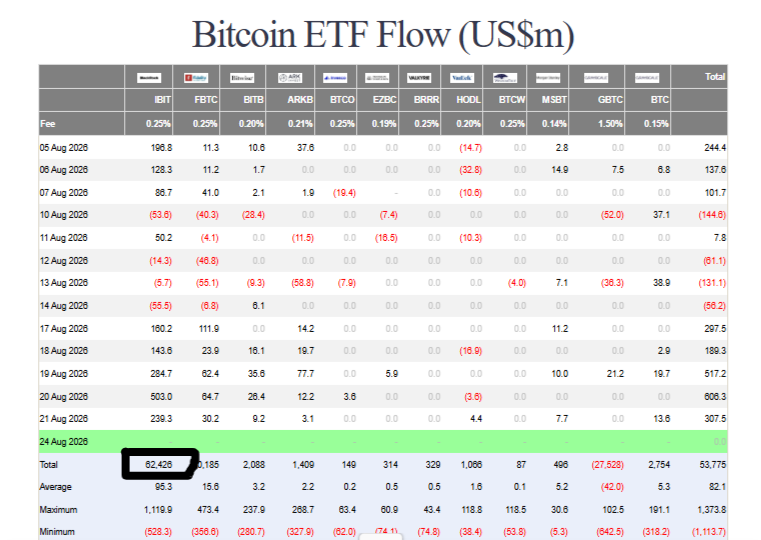
Data through late August 2026 shows IBIT accumulating roughly $62.4 billion in cumulative net inflows since the January 2024 launch of spot Bitcoin ETFs.
That figure stands well ahead of every competitor operating within the confines of the exchange-traded fund environment.
Total net inflows across the entire group of spot Bitcoin ETFs sit near $53.8 billion once Grayscale’s large outflows are factored in.
This concentration reflects more than short-term momentum. IBIT consistently captures the bulk of daily and weekly capital, often 70-80% or higher on strong inflow days.
Investors tracking institutional demand for Bitcoin exposure through regulated vehicles keep returning to the same fund.
Which Bitcoin ETF currently has the highest inflows?
IBIT currently posts the highest inflows by a wide margin. On August 20, 2026, the fund alone took in $503 million of the $606 million total that day—about 83% of all new capital.
The following session (August 21) brought another $239 million into IBIT while the broader group recorded $307.5 million.
Over the five trading days ending around August 21, the complex added roughly $1.92 billion, with IBIT driving the majority of that total.
Daily rankings shift slightly, yet the pattern holds: when money enters the sector, IBIT receives most of it.
Fidelity’s FBTC, Bitwise’s BITB, and ARK 21Shares’ ARKB pick up meaningful secondary amounts, but none approach IBIT’s scale.
Does BlackRock’s IBIT still lead Bitcoin ETF inflows?
Yes, IBIT has maintained leadership almost continuously since launch. Its cumulative net inflow total of approximately $62.4 billion dwarfs the rest of the field.
Its performance in recent weeks reinforce the position rather than challenge it. Even on mixed or negative days for the group, IBIT often limits losses better than peers or quickly resumes attracting capital once sentiment improves.
BlackRock’s distribution network, brand recognition among advisers and institutions, and deep liquidity in the secondary market all support this staying power. Many large allocators default to the most established and heavily traded vehicle.

How do IBIT inflows compare to Fidelity’s FBTC?
IBIT’s cumulative net inflows sit roughly six times higher than FBTC’s approximately $10.2 billion.
On individual strong days the gap can look even wider. For example, while IBIT absorbed $503 million on August 20, FBTC recorded about $65 million. On August 21 the split was $239 million versus $30 million.
Fidelity remains the clear number-two player and benefits from its own strong retail and advisor relationships.
FBTC occasionally posts competitive single-day numbers, particularly when overall flows are moderate.
Over longer periods, however, the cumulative difference continues to widen in IBIT’s favour. Both funds carry a 0.25% expense ratio, so fee competition is not the primary differentiator; scale, liquidity, and brand trust appear more decisive.
Which BTC ETF has the largest assets under management (AUM)?
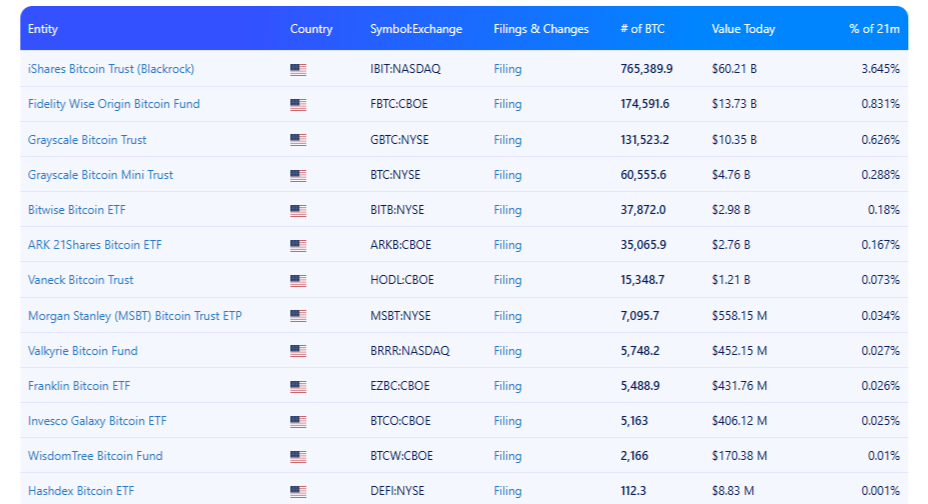
IBIT also leads in assets under management. Recent figures place it near $59–60 billion, depending on the exact day’s Bitcoin price and flow data.
Fidelity’s FBTC follows at roughly $13–14 billion, while Grayscale’s GBTC sits around $10 billion. Smaller products such as BITB, ARKB, and the Grayscale Mini Trust (BTC) trail further behind.
While assets under management and cumulative inflows are related they are not identical. Price appreciation of the underlying Bitcoin boosts AUM even without new creations, while redemptions reduce both.
IBIT’s dual leadership in flows and AUM shows its dominant market position.
What are the daily or weekly inflow rankings for Bitcoin ETFs?
Daily rankings almost always place IBIT first on inflow days. A typical strong session looks like this (approximate recent figures):
- IBIT: several hundred million
- FBTC: tens of millions
- BITB, ARKB, and smaller funds: single-digit to low double-digit millions
- GBTC: often flat or modestly negative
Weekly totals follow the same hierarchy. The week that delivered nearly $1.92 billion saw IBIT account for the clear majority.
Trackers such as Farside Investors and SoSoValue publish these breakdowns each trading day, making the ranking transparent and easy to monitor.
Why does BlackRock’s IBIT attract the most inflows?
Several structural advantages explain the persistent lead. BlackRock manages trillions in assets and maintains extensive relationships with financial advisers, wealth platforms, and institutional consultants.
That distribution reach funnels capital efficiently into IBIT. Secondary-market liquidity is exceptionally high, which reduces trading costs and attracts larger orders.
The 0.25% fee is competitive, and the fund’s early first-mover momentum after the 2024 approvals created a self-reinforcing cycle of visibility and trust.
Investors and advisers often prefer the product that already holds the deepest pool of capital and the tightest spreads. Once a fund reaches that critical mass, new money tends to follow existing money.

How much has IBIT received in cumulative net inflows since launch?
IBIT has accumulated approximately $62.4 billion in cumulative net inflows since the spot Bitcoin ETFs began trading in January 2024.
That total places it among the most successful ETF launches in history by capital raised in a relatively short period.
The figure continues to grow on net-positive days and remains the single largest contributor to the industry’s overall cumulative total.
Which BTC ETFs are seeing the strongest recent inflows?
Beyond IBIT, FBTC, BITB, and ARKB have posted the next-strongest recent inflows. On multi-hundred-million-dollar days for the group, these three funds routinely collect the bulk of the residual capital.
Grayscale’s lower-fee Mini Trust (BTC) has also shown intermittent strength. The rest of the field—VanEck’s HODL, Morgan Stanley’s MSBT, and smaller products—participates more sporadically and in smaller size.
Recent weeks of elevated total inflows (such as the nearly $2 billion stretch in mid-to-late August) still concentrated heavily in the top two or three names.
How do Grayscale’s GBTC flows compare to the newer spot BTC ETFs?
GBTC remains the outlier as it has recorded roughly $27.5 billion in cumulative net outflows since conversion to an ETF.
High expense ratio (1.50%) and the ability of long-time holders to exit at lower friction explain much of the persistent redemptions.
Newer spot products with fees of 0.20–0.25% have captured the majority of fresh capital that might otherwise have stayed in or entered the Grayscale complex.
GBTC’s AUM is still substantial because of the Bitcoin it continues to hold, yet its flow profile stands in sharp contrast to the consistent net creations seen at IBIT and FBTC.
What percentage of total Bitcoin ETF inflows does IBIT usually capture?
On strong inflow days IBIT frequently captures 70–85% of the total. On the $606 million day in late August it took roughly 83%.
Over longer multi-week periods the share often settles in the 60–75% range, still a dominant portion.
This concentration has been a consistent feature of the market rather than a temporary anomaly.
Are there any Bitcoin ETFs challenging IBIT’s dominance in inflows?
No fund has mounted a sustained challenge. FBTC remains a solid second but trails by a large absolute margin. Occasional days of stronger relative performance by BITB or ARKB occur, yet they do not alter the cumulative ranking.
Fee waivers, marketing campaigns, or temporary promotions have not shifted the structural preference for IBIT among the largest pools of capital.
Dominance can erode over time if liquidity or distribution dynamics change, but current evidence shows no near-term threat.

Where can I track daily Bitcoin ETF inflow data by fund?
Reliable public trackers include:
- Farside Investors (farside.co.uk/btc) – clean daily table by ticker
- SoSoValue – detailed dashboards and cumulative figures
- Additional visualisations appear on sites such as The Block, DefiLlama, and specialised BTC data platforms
These sources update after each U.S. trading session and provide both daily and cumulative views.
Cross-checking two or more reduces the chance of relying on provisional numbers before final settlement.
In short, BlackRock’s IBIT continues to set the pace for Bitcoin ETF inflows by a decisive margin.
Its combination of brand strength, liquidity, distribution, and early scale creates a durable advantage.
Investors monitoring institutional Bitcoin demand through ETFs will find the clearest signal in IBIT’s daily and cumulative flow numbers, with FBTC serving as the primary secondary gauge.
Data evolves every trading day, so consulting the live trackers remains the most practical way to stay current.
