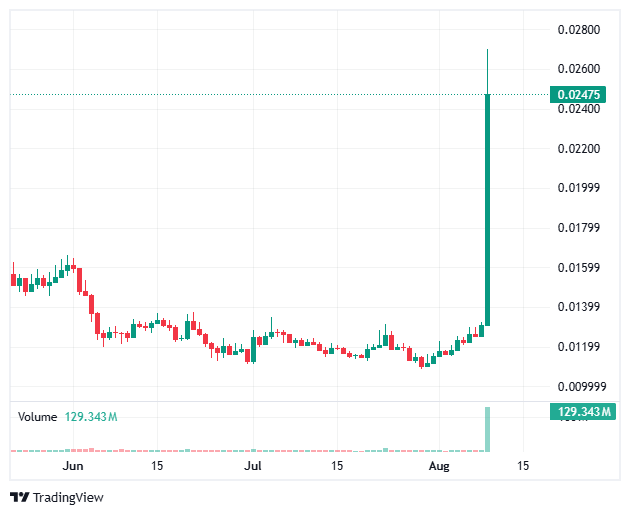


Bubblemaps (BMT) has just staged a powerful rally, climbing more than 80% in a single day while the broader cryptocurrency market remains largely bearish.
As a result, traders and investors now confront a familiar yet critical question: does this sharp ascent represent a genuine buying opportunity, or does it merely signal another high-volatility rebound destined to fade?
In the sections that follow, we examine the latest market data, the project’s core value proposition, the risks involved, and the practical considerations that arise after such a rapid move.
What Exactly Is Bubblemaps?
Bubblemaps operates as a specialised blockchain analytics platform that transforms complex on-chain data into intuitive visual “bubble maps.”
Moreover, these maps reveal token holder concentrations, wallet connections, and potential insider activity with unusual clarity.
In addition, the platform has become a widely referenced tool among researchers, traders, and investigators who seek to understand supply distribution and suspicious clustering.
Thus, Bubblemaps contributes tangible utility in an industry often plagued by opaque tokenomics.
Current market metrics show Bubblemaps trading near $0.022–$0.023 after the recent surge.
Furthermore, its market capitalisation stands around $16 million, supported by a circulating supply of approximately 716 million BMT out of a maximum supply of 1 billion.
At the same time, 24-hour trading volume exploded past $115 million, producing an exceptionally high volume-to-market-cap ratio that shows intense short-term speculative interest.

Why Did Bubblemaps Ascend More Than 80% in 24 Hours?
Several factors combined to fuel the rapid price increase.
First and foremost, trading volume surged dramatically—rising thousands of percent in some reports—and far exceeded the token’s market capitalisation.
In addition, the move unfolded against a relatively quiet broader market, allowing speculative capital to concentrate on a smaller asset.
Therefore, the rally appears driven primarily by renewed attention to the platform’s analytics utility and by short-term momentum rather than by a single major announcement.
Furthermore, Bubblemaps benefits from established integrations with popular tools and from its reputation as a go-to resource for on-chain investigations.
As a result, any renewed narrative around transparency or token research can quickly amplify buying pressure.
Nevertheless, such volume spikes frequently prove temporary; once the initial wave of interest subsides, price can reverse with equal speed.
How Does the Current Bearish Market Environment Affect Bubblemaps?
The wider cryptocurrency market continues to display cautious sentiment, with many large-cap assets trading sideways or lower.
Against this backdrop, Bubblemaps’ isolated strength stands out sharply.
However, assets that rally aggressively while the rest of the market stagnates often attract rapid profit-taking once the excitement cools.
Thus, traders must monitor Bitcoin dominance, overall market capitalisation trends, and risk appetite with heightened attention.
In addition, mid- and small-cap analytics tokens historically exhibit elevated volatility during risk-off periods.
Therefore, any position in Bubblemaps carries amplified downside exposure if broader sentiment deteriorates further.
What Are the Key Strengths and Weaknesses of Bubblemaps?
Strengths
- Clear and differentiated utility as a leading on-chain visualisation and investigation tool.
- Demonstrated product adoption through integrations and consistent usage among researchers.
- Relatively strong profile metrics and a track record of raising institutional funding.
- High recent liquidity that currently supports reasonable entry and exit.
Weaknesses and Risks
- The current price surge remains heavily speculative in nature.
- Extremely elevated 24-hour volume relative to market capitalisation signals potential fragility.
- The token still trades far below its all-time high near $0.32, reflecting previous drawdowns.
- Competition in the blockchain analytics space continues to intensify.
Moreover, while the platform delivers genuine value, token price performance does not always track product adoption in a linear fashion.
As a result, investors must separate the quality of the tool from the speculative dynamics of the BMT token.
Should You Buy BMT Right Now?
The decision hinges on individual risk tolerance, time horizon, and position-sizing discipline.
On one hand, the combination of real utility and fresh momentum could attract additional interest in the near term.
On the other hand, purchasing after an 80%+ daily ascent places new capital at elevated risk of a swift reversal.
Therefore, any consideration of an entry should follow strict risk management principles: limit allocation to a small percentage of overall capital, define clear invalidation levels in advance, and avoid leverage.
In addition, waiting for volume to normalise or for price to consolidate after the parabolic move frequently produces more favourable risk-reward profiles than chasing the initial vertical advance.

Frequently Asked Questions About Bubblemaps
What is the current market ranking and liquidity profile of Bubblemaps?
Bubblemaps currently ranks in the mid-to-upper hundreds by market capitalisation.
Meanwhile, the surge in 24-hour volume has created temporary high liquidity across major centralised exchanges (CEXs) and decentralised exchanges (DEXs), although that liquidity can evaporate quickly if sentiment shifts.
Does Bubblemaps deliver real utility beyond speculative trading?
Yes. The platform’s bubble-map visualisations provide practical insights into token distribution, wallet clustering, and potential insider activity.
Furthermore, its integrations with widely used crypto tools reinforce its role as a research resource rather than a pure meme asset.
How does Bubblemaps compare with other blockchain analytics tokens?
Many analytics projects compete for attention, yet Bubblemaps has carved a recognisable niche through its distinctive visual approach and cultural presence within the crypto community.
Therefore, its brand recognition offers a modest edge, even as competition remains intense.
What risks should investors prioritise after the sharp 24-hour ascent?
The foremost risks include a sudden collapse in trading volume, aggressive profit-taking by short-term holders, and a broader market downturn that reduces appetite for mid-cap tokens.
In addition, token unlock schedules and supply dynamics always warrant monitoring.
As a result, thorough due diligence and conservative position sizing remain essential.
Is now a good time to take profits if you already hold BMT?
Holders who entered at lower levels may reasonably consider partial profit-taking after such a large move.
Scaling out in stages while retaining a core position allows continued exposure to any further upside while securing gains.
Conversely, new buyers confront a less attractive entry point after the rapid ascent.
Final Perspective on Bubblemaps After the Ascent
Bubblemaps has demonstrated the explosive short-term potential that can accompany renewed attention to useful on-chain tools.
At the same time, the magnitude of the 24-hour gain, the extreme volume ratio, and the still-modest market capitalisation all point to elevated risk.
Thus, investors who prioritise capital preservation should approach with caution or wait for clearer signs of consolidation.
Meanwhile, those comfortable with high-volatility speculation may allocate only risk capital they can afford to lose entirely.
In either case, continuous monitoring of volume, on-chain activity, and broader market conditions remains indispensable.
Ultimately, no single price surge guarantees sustained appreciation. Instead, disciplined analysis, realistic expectations, and rigorous risk controls determine whether participation in Bubblemaps proves constructive or costly.
In the highly volatile crypto market, you should embark on independent research and never invest more than you can afford to lose.