

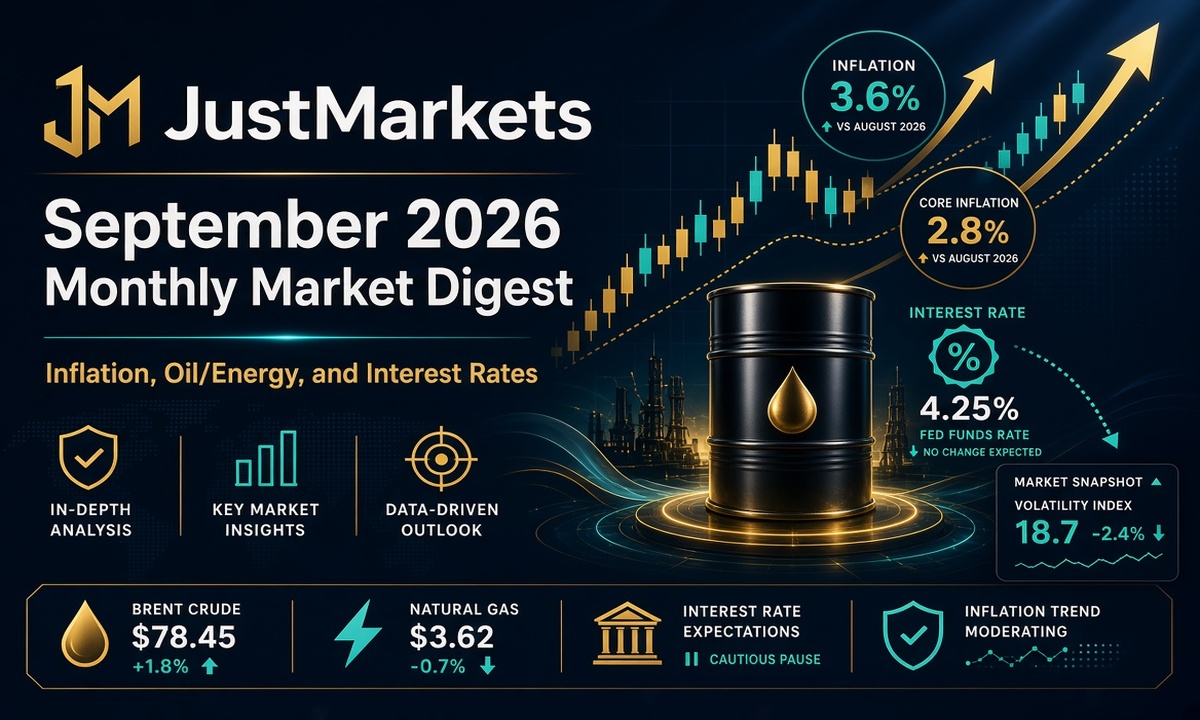
September was defined by a rapid repricing of the global rates outlook amid rising inflation.
Stronger-than-expected US employment data initially challenged expectations for easier policy, but the decisive shift came from oil: renewed Middle East supply concerns pushed crude above $100 per barrel and fed directly into inflation expectations.
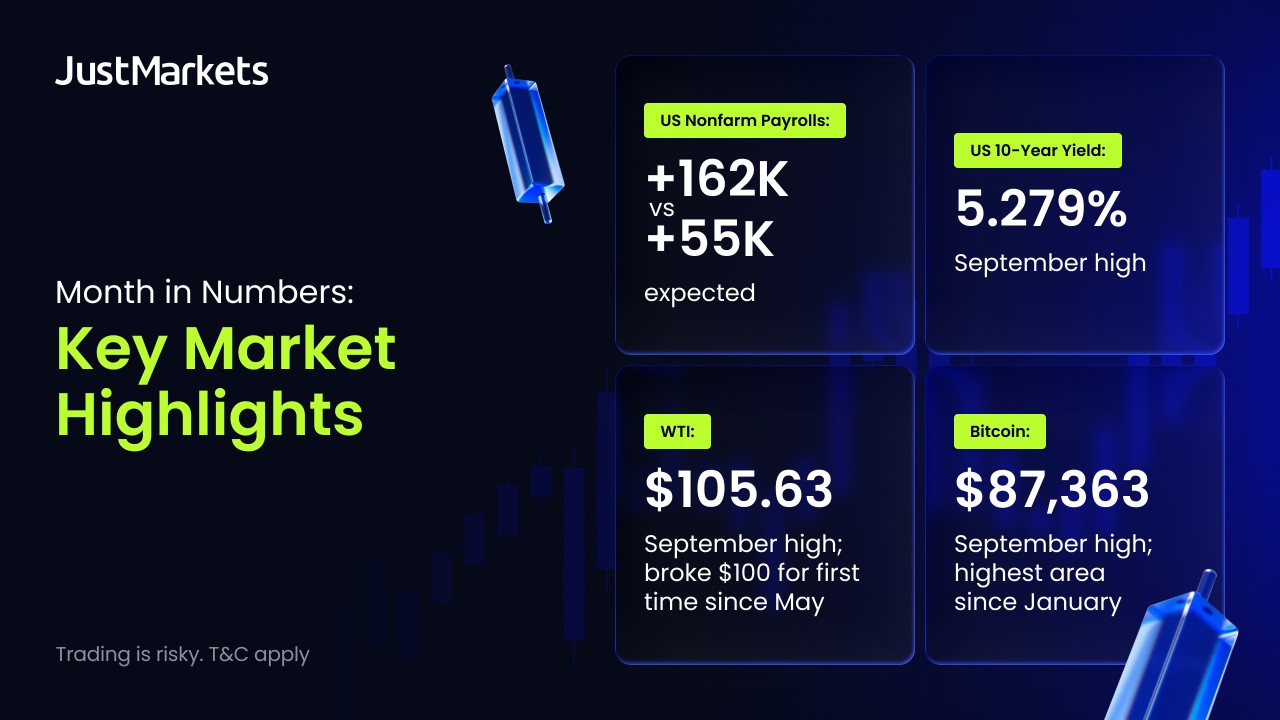
Month in Numbers
| Indicator / Asset | Key Monthly Milestone |
| US Nonfarm Payrolls | +162K vs +55K expected |
| US CPI | +0.4% MoM; +3.4% YoY |
| ECB Deposit Rate | 2.50% after a 25 bp hike |
| Federal Funds Target | 3.75%–4.00% after the first hike since 2023 |
| Bank of England Rate | 3.75%, held in a 6–3 vote |
| Bank of Japan Rate | 1.25%, highest since 1995 |
| RBA Cash Rate | 4.60%, highest since 2011 |
| WTI | $105.63 September high; broke $100 for the first time since May |
| US 10-Year Yield | 5.279% September high |
| US 30-Year Yield | 5.583% September high |
| Nasdaq Composite | 27,288.79 intraday September high |
| Bitcoin | $87,363 September high; highest area since January |
Fundamental Highlights
Strong US payrolls reset the Fed debate
The month began with a clear challenge to the idea that the US economy was cooling quickly enough to remove inflation pressure.
August Nonfarm Payrolls increased by 162,000, far above the 55,000 expected, while unemployment held at 4.1%. The revisions for June and July payrolls increased the total by 55,000 jobs.
The report mattered less because of the absolute pace of job creation than because it changed the policy balance. A still-resilient labour market gave the Federal Reserve more room to respond to renewed inflation risks, and markets increased expectations that the next Fed move could be a hike rather than an extension of the existing pause.

Oil above $100 turns geopolitics into an inflation shock
That shift in rate expectations accelerated when the Middle East conflict began feeding directly into energy markets. Renewed US-Iran military strikes and fighting involving Houthi and Saudi forces intensified concerns over regional supply disruptions and already-restricted flows through the Strait of Hormuz.
WTI surged 8.1% in one session to $103.87, its first settlement above $100 since May 19, while Brent jumped 7.3% to $108.60. WTI ultimately reached a September high of $105.63. The significance extended well beyond commodities: higher oil prices threatened to keep headline inflation elevated, pressured bonds and complicated the policy outlook for central banks that had been waiting for inflation to normalise.
ECB raises rates as energy risks return
Europe was one of the first major economies to respond. In September, the European Central Bank raised its deposit rate by 25 basis points to 2.50%, explicitly acknowledging renewed inflation pressure linked to the Middle East energy shock.
ECB staff projected headline inflation of 3.0% in 2026, while also raising the 2027 and 2028 forecasts to 2.5% and 2.1% respectively. The decision reinforced the idea that the oil shock was becoming a global monetary-policy issue rather than a temporary commodity-market event. European sovereign yields remained elevated, with German and French long-term borrowing costs trading around historically high levels.
US CPI confirms that inflation pressure is rebuilding
The following day brought another important confirmation. The US headline CPI rose 0.4% month-on-month (MoM) and 3.4% year-on-year (YoY) in August. Core inflation increased by 0.3% month-on-month, above the 0.2% consensus, while annual core CPI eased only slightly to 2.4%.
Energy was already visible in the data: gasoline prices rose 3.9% in the month, and the broader energy index increased 2.1%.
Combined with the earlier payroll surprise and the oil rally, the CPI report strengthened the argument that monetary policy might need to become more restrictive again rather than simply remain unchanged.
Fed delivers its first rate increase since 2023
The repricing culminated on September 16. The Federal Reserve unanimously raised the federal funds target range by 25 basis points to 3.75%–4.00%, its first tightening move since July 2023. The new projections also pointed to the possibility of at least one further increase before year-end, with the median end-2026 policy-rate projection at 4.1%.
The decision confirmed a major change in September’s narrative. Resilient economic activity, limited progress on inflation and the renewed energy shock had collectively outweighed arguments for patience. US stocks initially held gains before reversing lower, while the 10-year Treasury yield traded around 5.01%, highlighting how quickly tighter policy was being transmitted into financial conditions.
Bank of England holds, but the message turns more hawkish
The Bank of England stopped short of joining the rate-hike cycle immediately, keeping the Bank Rate at 3.75% on September 17 in a 6-3 vote. But the accompanying message was considerably less comfortable with inflation than before.
The BoE said CPI could move above 4% early in 2027, compared with a previously expected peak of around 3.2% in October or November 2026. Prolonged energy-price volatility, according to Governor Andrew Bailey, has increased the likelihood that tighter policy may eventually be necessary. The hold, therefore, looked less like a dovish decision and more like a pause while policymakers assessed the persistence of the shock.
Bank of Japan lifts rates to the highest level since 1995
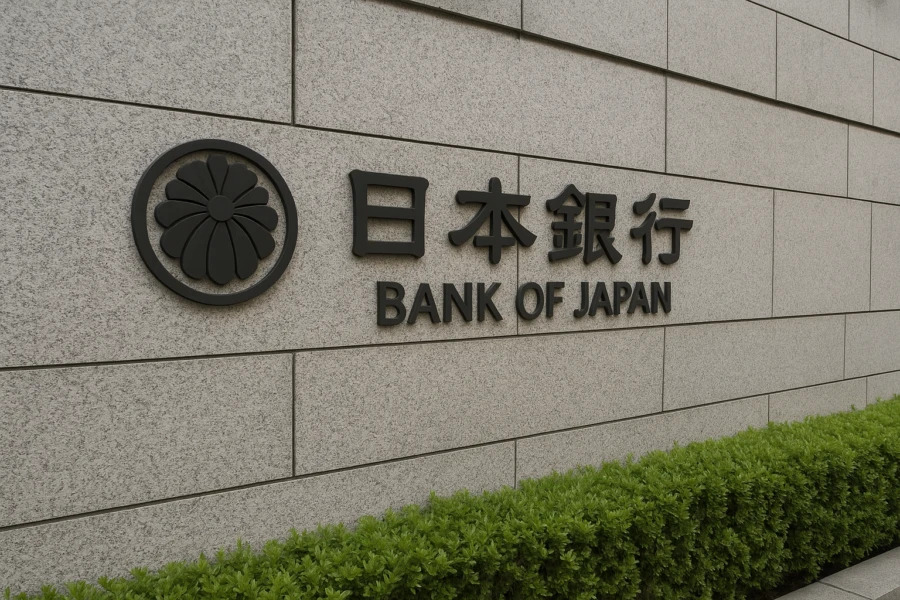
A day later, the Bank of Japan raised its overnight call rate by 25 basis points to 1.25%, the highest level since 1995 and its second increase of 2026. The decision passed by a 7–2 majority.
The BoJ pointed out that energy prices and strong technology-related demand posed inflation risks, indicating that further increases could occur if its outlook materialised. Yet the yen weakened after the announcement, with USD/JPY rising around 0.7%, while the Nikkei gained roughly 2.1%. That reaction underscored how much additional tightening the markets had already priced into Japan.
The global bond selloff becomes a cross-asset story
Sovereign debt increasingly became the most important market signal by the final third of September. On September 24, the US 10-year yield reached 5.205%, its highest level since 2007, while the 30-year yield rose to 5.489%, it’s highest since 2004.
The selloff continued, with Investing.com historical data showing September highs of 5.279% for the 10-year and 5.583% for the 30-year. Higher oil prices, stronger activity, expectations of additional Fed tightening and heavy corporate borrowing linked partly to AI investment all contributed. The result was a tightening of financial conditions even beyond what central banks had delivered directly.
RBA joins the tightening wave
September closed with another major central bank move. On September 29, the Reserve Bank of Australia raised its cash rate by 25 basis points to 4.60%, the highest level since 2011 and its fourth increase of 2026. The decision was unanimous.
The RBA said inflation remained above its 2%–3% target and that domestic demand continued to exceed supply capacity. Governor Michele Bullock also indicated the possibility of further increases. By then, the broader September pattern was unmistakable: what began as an oil shock had evolved into a synchronised concern that inflation could remain stronger for longer across several major economies.
Key Technical Milestones
WTI – Crude breaks $100 and reaches $105.63
- Milestone: WTI moved above $100 per barrel for the first time since May, eventually reaching a September high of $105.63. The breakout transformed $100 from a distant psychological threshold into the month’s central commodity-market level.
- Why it happened: Regional military escalation and reduced traffic through the Strait of Hormuz raised immediate concerns about global supply availability.
- What could be next: Because the breakout was not sustained into the end of the month, $100 becomes the first major recovery threshold, while $105.63 marks the September ceiling. Failure to reclaim $100 could suggest that the initial geopolitical risk premium was continuing to unwind.
Brent – Global benchmark approaches $110
- Milestone: Brent also cleared $100 and reached an intra-month high of approximately $109.97, bringing the global benchmark close to the psychologically important $110 level.
- Why it happened: The same Middle East supply fears that lifted WTI had an even broader implication for Brent because of its role as the principal international crude benchmark.
- What could be next: The $110 area is the obvious upside reference left by September’s surge. On the downside, $100 has become the key structural pivot: sustained trading below it could indicate that the breakout had failed, while a renewed move above it would keep the September high in focus.
US Treasuries – 10-year clears 5% as the 30-year reaches 5.58%
- Milestone: The US 10-year yield moved above 5% and traded as high as 5.279%, while the 30-year reached 5.583%. Investing.com described the move as taking 10-year yields to their highest levels since 2007 and 30-year yields to levels not seen since 2004.
- Why it happened: Oil-driven inflation pressure, resilient US activity, the Fed hike and heavy borrowing demand combined to push term yields sharply higher.
- What could be next: For the 10-year, 5% is now the central psychological pivot, while 5.279% and 5.583% are the respective September highs to watch for renewed bond-market stress.
Nasdaq Composite – Technology shares return to record territory
- Milestone: Despite the rates shock, the Nasdaq Composite returned to record territory. It closed at 27,122.09 on September 21, its first record close since June, before extending to 27,244.28 the following session and reaching an intraday high of 27,288.79.
- Why it happened: Persistent enthusiasm around AI-related companies helped offset the pressure from higher yields, particularly during periods when oil prices temporarily eased.
- What could be next: The 27,289 area is the key breakout threshold. September’s low near 25,803 provides the more important downside reference; movement between those two extremes would leave the index consolidating after its record attempt.
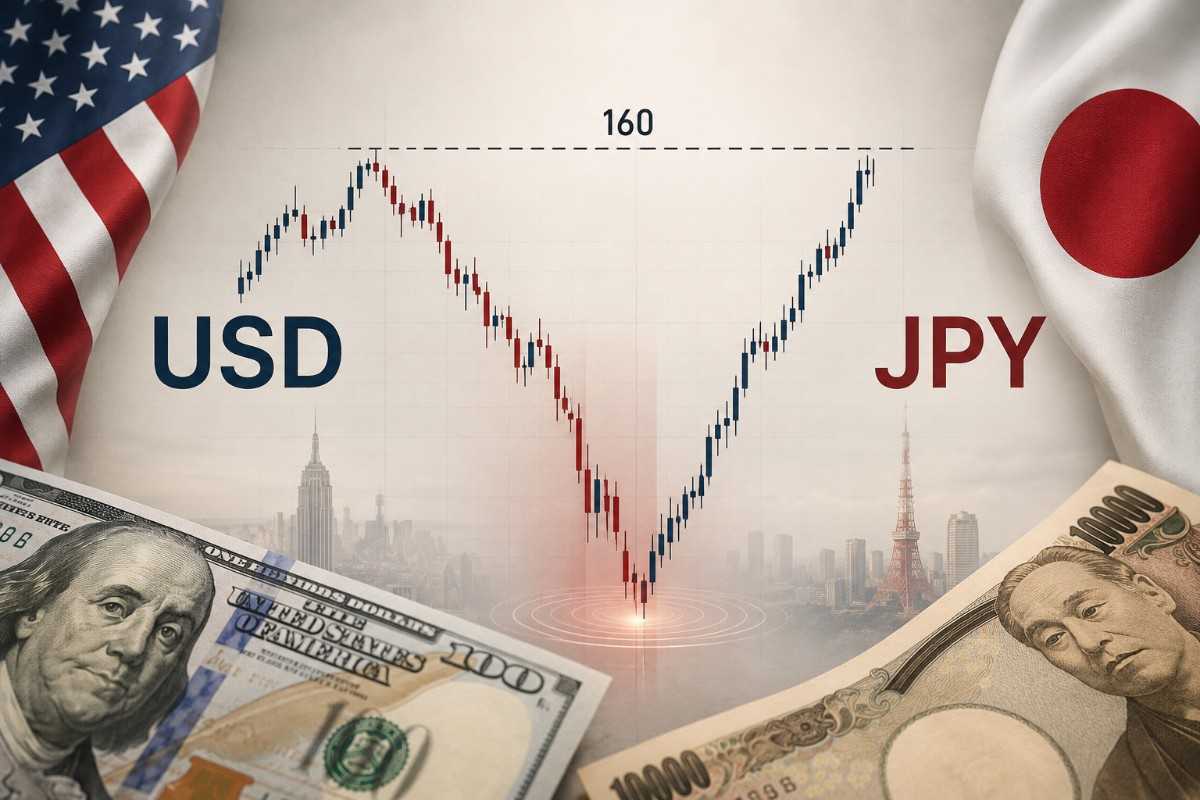
USD/JPY – 160 becomes the month’s critical FX boundary
- Milestone: USD/JPY reached approximately 160.40 early in September, then reversed as low as 152.89 before recovering toward 159 later in the month.
- Why it happened: The pair was pulled between expectations for tighter Japanese policy, intervention sensitivity around the 160 region and the renewed rise in US yields. Even the BoJ’s September hike failed to generate sustained yen strength, with the currency weakening immediately after the decision.
- What could be next: The 160 area remains the dominant upside boundary, while 152.89 is September’s key reversal low. A break outside that broad range would provide a clearer signal than movements inside it.

US Dollar Index – DXY reclaims 100 and reaches a two-month high
- Milestone: The Dollar Index recovered from a September low near 98.60, moved back above the psychological 100 level and reached approximately 101.62 late in the month, around a two-month high.
- Why it happened: Higher Treasury yields and expectations that US policy could remain restrictive–or tighten further–restored the dollar’s rate advantage against several major currencies.
- What could be next: Holding above 100 would keep the late-September breakout intact. The next major verified upside reference is the 101.80 52-week high, while a return below 100 would weaken the month’s bullish dollar structure.

Bitcoin – Recovery reaches the highest area since January
- Milestone: Bitcoin rallied to approximately $87,363, its highest level since late January, after beginning the month near the upper-$70,000 area. September’s observed low was approximately $75,026.
- Why it happened: Crypto initially benefited from renewed risk appetite, but the rally became harder to sustain as Treasury yields moved above 5%, the dollar strengthened and central-bank expectations turned more restrictive. Bitcoin had retreated toward the low-$80,000s by the final days of the month.
- What could be next: The $87,363 September high is the immediate breakout threshold. $80,000 is the key psychological pivot, while a move below the roughly $75,000 monthly low could point to a weaker structure.
Monthly Takeaway
September began with a familiar question: whether economic resilience would allow central banks to keep rates restrictive for longer. However, the initial question about whether economic resilience would allow central banks to maintain restrictive rates for an extended period evolved into a significantly different question: whether a renewed inflation shock would necessitate additional tightening. Strong US payrolls weakened the case for easier policy, while the surge in oil above $100 transformed geopolitical risk into a direct inflation problem.
The response quickly became global. The ECB, Fed, BoJ and RBA all raised rates during the month, while the BoE explicitly warned that persistent energy pressure could require tighter policy. The clearest cross-asset consequence was the bond selloff: US long-term yields climbed to levels not seen since the mid-2000s, strengthening the dollar and increasing the discount-rate pressure facing equities and cryptocurrencies.
Yet risk assets did not move uniformly. The Nasdaq still reached new records as the AI theme remained powerful, while Bitcoin briefly climbed to its highest level since January before higher yields began to bite. Oil, bonds, the dollar, and growth assets conveyed different aspects of the same narrative: September primarily involved a reassessment of inflation persistence and the cost of capital.
Heading into October, the unresolved question is whether the energy shock proves persistent enough to keep central banks in tightening mode or whether softer demand and easing commodity pressure begin to reverse September’s sharp rise in yields.
Risk Warning: Trading Forex and CFDs involves significant risk and can result in the loss of your invested capital. This article is for informational purposes only and does not constitute investment advice.
