

Chainalysis released fresh numbers that reshape how we view crypto in Central and Southeast Asia plus Oceania (CSAO).
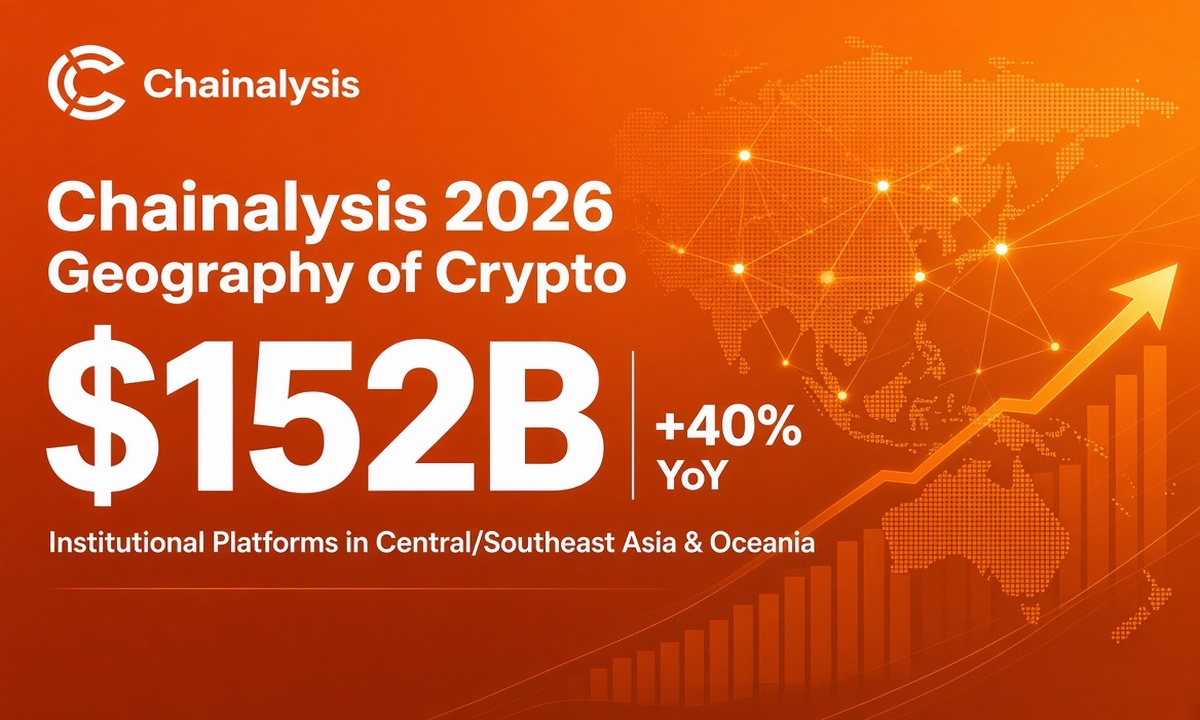
The latest Geography of Crypto report shows institutional platforms in the region processed $152.3 billion between July 2025 and June 2026.
That marks a solid 40% rise from the prior year. Their share of total regional activity climbed to 18.9% by the end of Q2 2026.
Yet, the broader CSAO crypto economy still contracted 6.8%. While growth did not vanish, it simply shifted toward more practical uses and bigger players.

Chainalysis 2026 Geography of Crypto: What Does the $152 Billion Figure Actually Mean for Institutional Platforms?
Institutional platforms here include market makers, prime brokers, over-the-counter (OTC) desks, custodians, and institutional-only exchanges.
Chainalysis tracks the value flowing through these channels. The jump to $152.3 billion signals that professional capital is settling into the region rather than treating it as pure speculation.
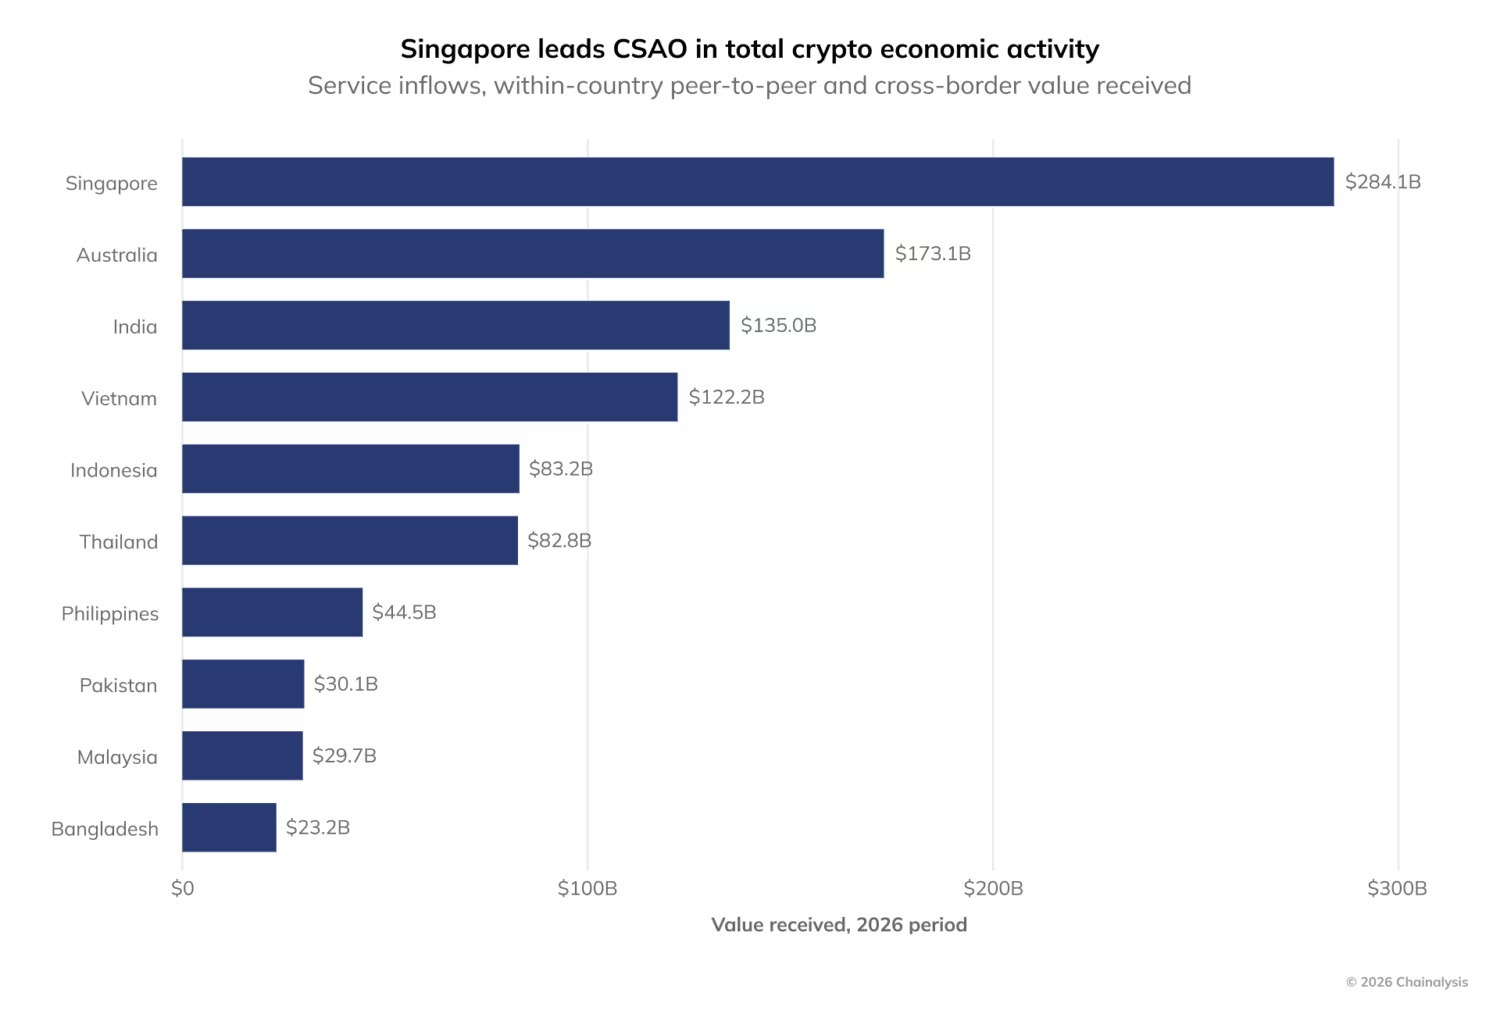
Singapore led the charge. Its overall crypto economy reached $284 billion, a 55.4% increase.
Institutional-platform activity there surged 94% to $60 billion. Much of that volume came from a concentrated group of existing market makers and OTC firms rather than a flood of new entrants.
Australia followed with institutional inflows up 33.3% to nearly $40 billion, even as its total economy slipped 5.6% to $173.1 billion.
Why Did Institutional Activity Rise While the Overall Regional Economy Shrank?
The regional decline hides uneven progress. Speculative trading cooled in several markets during the broader 2025-2026 downturn. At the same time, infrastructure-focused flows gained traction.
Singapore and Australia both improved on Chainalysis’s financial and utility indexes.
Singapore’s centralised-exchange flows rose 30% and decentralised exchange flows climbed 69%.
Australia saw continued strength in custodian and OTC activity. India remained large at $135 billion despite a 14.7% contraction, driven largely by centralised-exchange volume.
Meanwhile, utility use cases expanded elsewhere. The Philippines, Thailand, and Vietnam together accounted for 14.4% of all global small-value peer-to-peer (P2P) transfers under $10,000, even though they represent only 2.5% of the world’s measured crypto economy.
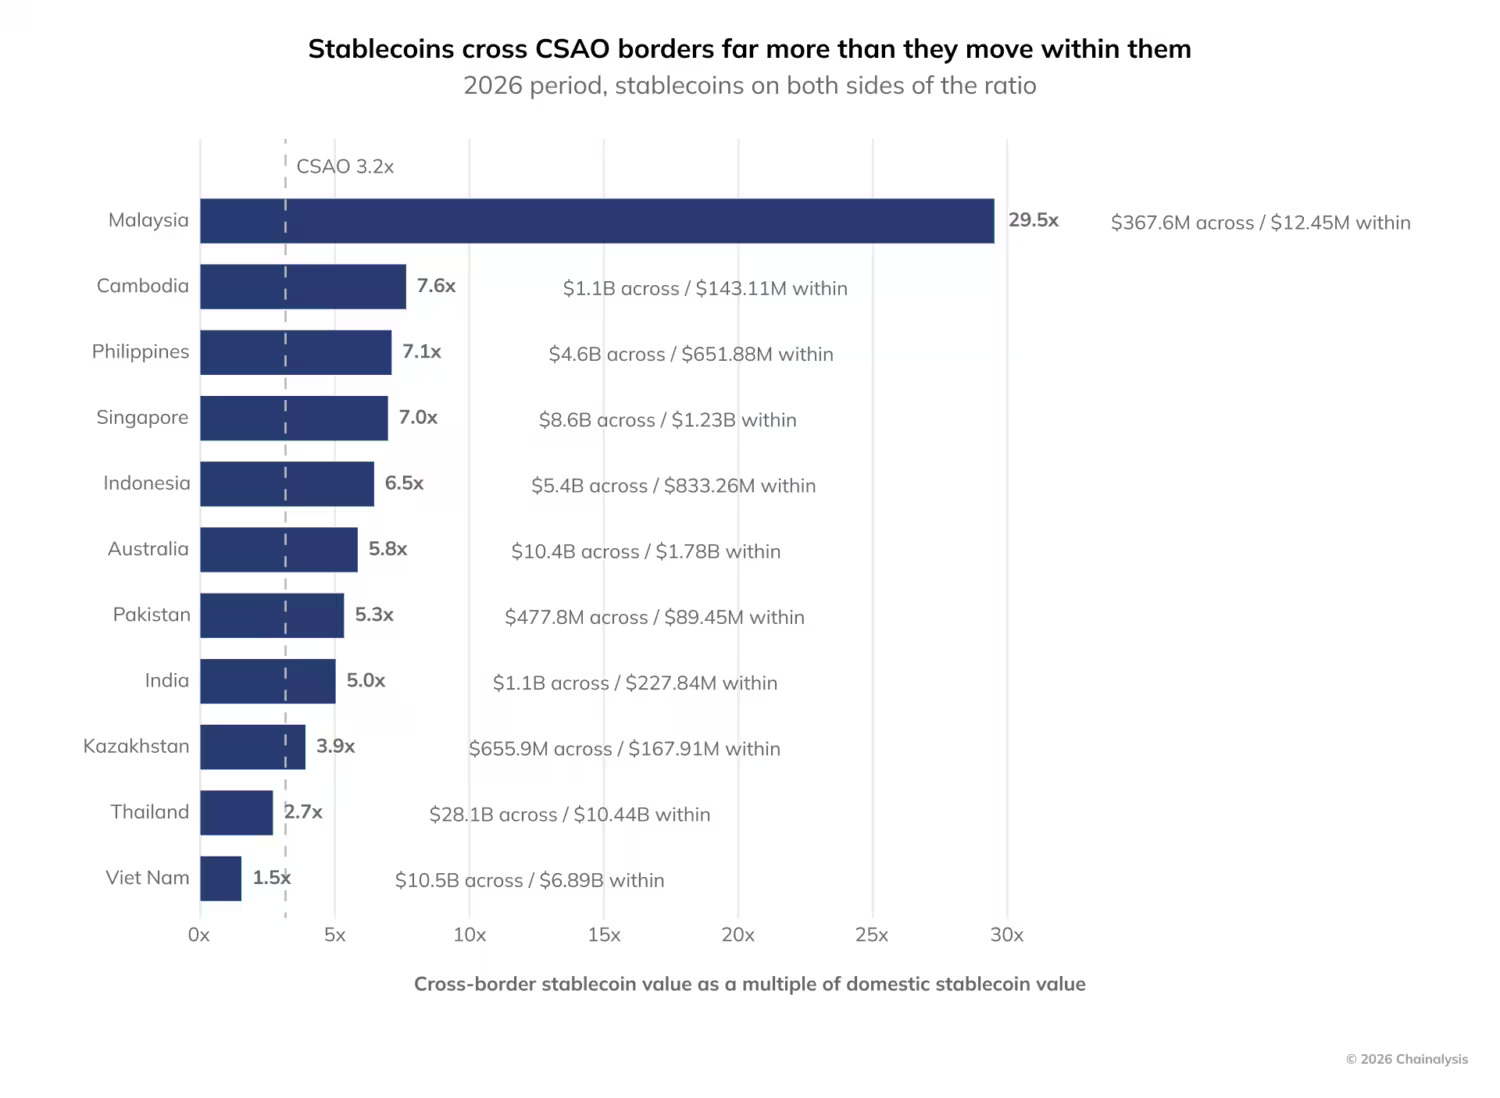
Stablecoins played a starring role in cross-border movement. In every market Chainalysis examined, cross-border stablecoin activity exceeded domestic activity. Malaysia posted a striking 29.5-to-1 ratio.
How Are Stablecoins and Cross-Border Payments Changing the Region’s Crypto Story?
Stablecoins have moved beyond trading pairs. They now function as practical rails for moving money across borders.
Chainalysis data shows cross-border stablecoin value across the region ran 3.2 times higher than domestic stablecoin activity.
This shift aligns with everyday needs. Remittances, trade settlement, and treasury operations benefit from lower costs and faster settlement than traditional corridors.
Experts quoted in the report point to regulation and infrastructure as the next catalysts.
Clearer rules in Singapore, Australia, and emerging frameworks elsewhere encourage institutions to treat crypto as operational infrastructure rather than a side bet.
Chainalysis 2026 Geography of Crypto: What Does This Mean for the Next Phase of Crypto in CSAO?
Crypto in the region is evolving from an asset class into working infrastructure.
Chainalysis notes growing use in cross-border payments, tokenization, treasury management, and settlement.
The institutional $152.3 billion figure, combined with rising utility activity in Southeast Asian markets, suggests the foundation is strengthening even while total measured volume dipped.
Singapore’s concentrated institutional growth and Australia’s custodian-driven inflows show professional capital is already positioning itself.
At the same time, the outsized share of global small-value P2P transfers from the Philippines, Thailand, and Vietnam demonstrates grassroots utility remains vibrant.
Stakeholder of crypto behaviour in Asia can explore the full methodology and country-level breakdowns in the Chainalysis 2026 Geography of Crypto Report.
The data covers on-chain activity measured through service inflows, domestic peer-to-peer (P2P) transfers, and cross-border wallet movements for the twelve months ending June 30, 2026.
The takeaway feels straightforward. Volume may have softened overall, yet the quality of activity is rising.
Institutional platforms are capturing a larger slice, stablecoins are handling more real-world transfers, and key markets continue building practical use cases.
That combination positions Central and Southeast Asia plus Oceania for steadier, more integrated growth ahead.
