

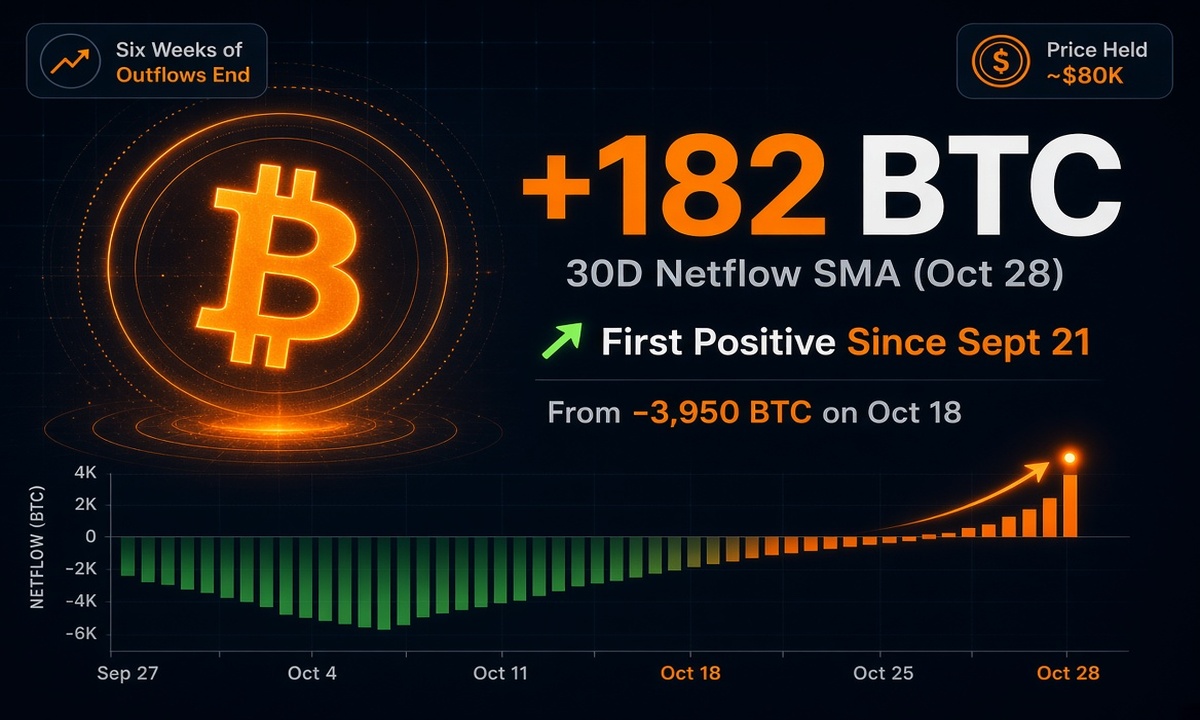
Bitcoin just flashed a quiet but meaningful signal. After six straight weeks of coins streaming off exchanges, the 30-day average exchange netflow flipped positive.
On Wednesday, October 28, 2026 it sat at +182 BTC. Ten days earlier the same reading stood at 3,950 BTC.
That swing ends the longest stretch of net withdrawals since late summer.
Holders have clearly slowed their withdrawals. At the same time, large sellers have yet to show up in force.
The current positive reading remains tiny compared with the heavy inflows that marked earlier sell-offs.
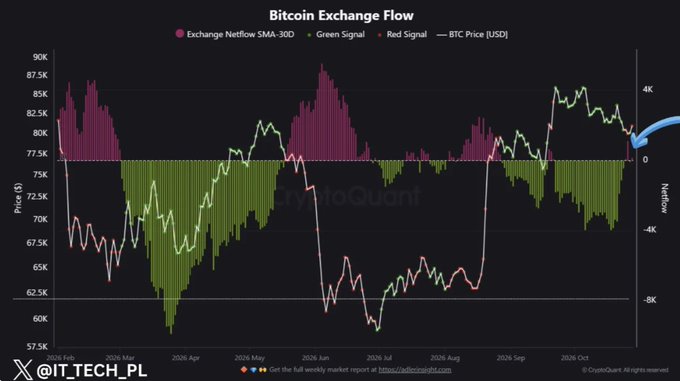
In February and June, those periods ran at +4,000 to +5,000 BTC for weeks and helped drive sharp drops from the high 80s into the low 60s.
Today’s +182 BTC figure sits well below those levels, and Bitcoin has so far held near the $80,000 area through the shift.
What Does Positive Bitcoin Exchange Netflow Actually Signal?
Exchange netflow simply tracks whether more Bitcoin is moving onto trading platforms than leaving them.
A positive number means deposits are outpacing withdrawals. That can open the door to selling, yet it does not guarantee sales will arrive.
Coins can sit on exchanges as collateral, OTC inventory, or simply idle balances for days or weeks.
Right now the data shows holders have stopped pulling coins out, while genuine distribution pressure has not appeared in size.

Why Did Bitcoin’s Netflow Flip Positive Right Now?
The change arrived after a prolonged period of accumulation-style behaviour. For roughly six weeks, coins left exchanges faster than they arrived, tightening liquid supply.
Once that steady outflow slowed, the 30-day average crossed back above zero.
The move happened while price stayed relatively stable around $80,000, suggesting the market absorbed the shift without immediate panic.
Meanwhile, the broader backdrop—options expiry, rate decisions, and lingering macro uncertainty—has kept traders cautious rather than aggressive.

How Does This Stack Up Against Earlier Bitcoin Corrections?
Look at the contrast. February’s and June’s sustained +4K–5K BTC netflows coincided with multi-week declines of 25–28%.
The present reading is less than 5% of those peaks. In other words, the current inflow remains modest.
Still, history shows that once the 30-day average climbs past roughly +2,000 BTC and price loses the $80,000 handle, the next liquidity pocket often sits in the $77,000–$75,800 zone.
That combination has not yet arrived.

What Should Bitcoin Traders Watch Next?
Keep an eye on two things: whether the 30-day netflow average continues rising toward or beyond +2,000 BTC, and whether Bitcoin can hold above $80,000.
A break below that level paired with heavier inflows would raise the odds of a deeper test.
On the other hand, if inflows stay light and price stabilises, the earlier outflow trend may simply have paused rather than reversed into full distribution.
Either way, the data gives a clearer picture of holder behaviour than price alone.
BTC’s latest netflow reading does not scream panic. It does, however, mark the end of a six-week outflow streak and puts a fresh spotlight on exchange balances.
Traders now have a concrete number to track as the market decides its next move.
