


U.S. spot Bitcoin and Ethereum ETFs have just delivered their strongest weekly performance since mid-April, attracting a combined $1.1 billion in net inflows.
As a result, market participants are carefully examining whether this renewed institutional demand signals a meaningful shift in sentiment or simply a temporary rebound after a quieter summer period.
In the following analysis, we examine the precise figures, the drivers behind the flows, the broader implications, and the practical questions that investors are asking right now.
What Exactly Happened with Spot Bitcoin and Ethereum ETFs Last Week?
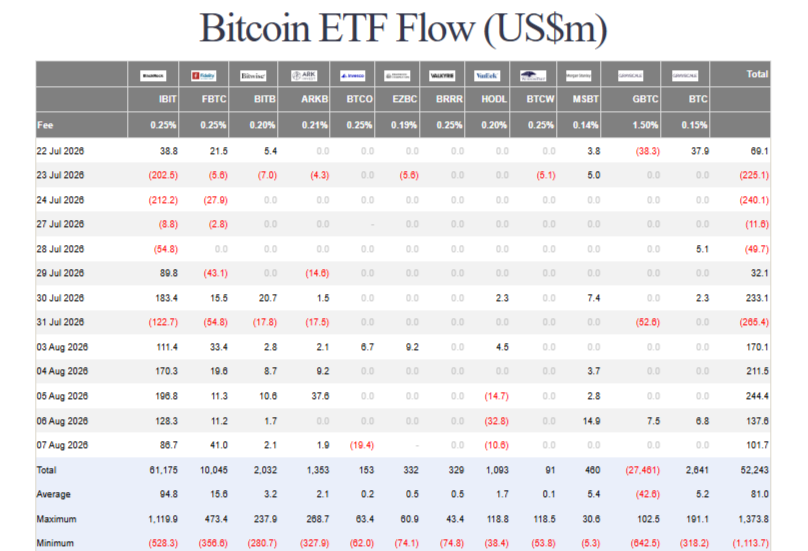
U.S.-listed spot Bitcoin ETFs recorded approximately $853–854 million in net inflows across the five trading sessions ending August 7–8, 2026.
Moreover, spot Ethereum ETFs contributed roughly $245 million over the same period.
In addition, the combined total of about $1.1 billion marked the strongest weekly result for both categories since the week ending April 17.
Thus, the data points to a clear recovery in regulated institutional demand after a stretch of weaker or mixed flows.
Furthermore, Bitcoin ETFs posted positive inflows on every single trading day of the week, while Ethereum ETFs extended their streak to five consecutive positive weeks.
At the same time, BlackRock’s products dominated the activity, with IBIT alone accounting for more than 80% of Bitcoin ETF inflows and ETHA capturing the large majority of Ethereum flows.

Why Did ETFs Inflows Strengthen So Sharply?
Several factors appear to have supported the rebound. First and foremost, price stability in Bitcoin near the $65,000 level and a modest recovery in broader risk appetite encouraged institutional allocators to rebuild positions.
In addition, the concentration of flows into the largest and most liquid products (primarily BlackRock) suggests that investors favoured established vehicles rather than spreading capital more widely.
Therefore, the pattern looks more like a measured return of core exposure than a broad speculative surge.
Furthermore, the inflows occurred despite relatively subdued overall trading volumes in the crypto market.
As a result, the strength of the ETF numbers stands out even more clearly against a quieter backdrop.
Nevertheless, one week of strong data does not yet confirm a sustained trend reversal.
How Does This Week Compare with Earlier 2026 Performance?
Earlier in the summer, Bitcoin ETFs experienced periods of net outflows, including a modest negative week just prior to this rebound.
Against that backdrop, the latest $854 million Bitcoin inflow and $245 million Ethereum inflow represent a meaningful improvement.
However, the figures still fall short of the peak weekly totals recorded during stronger periods earlier in the year.
Thus, the current reading signals recovery rather than a return to full risk-on conditions.
In addition, Ethereum’s five-week positive streak is particularly noteworthy, as it demonstrates more consistent demand for the second-largest cryptocurrency through regulated channels.
Therefore, both assets are currently benefiting from renewed institutional interest, albeit at different intensities.
What Are the Key Implications of These ETFs Flows?
Positive Signals
- Institutional capital is returning to the two largest digital assets through regulated products.
- BlackRock’s continued dominance reinforces the preference for highly liquid, brand-name vehicles.
- Ethereum’s multi-week inflow streak suggests growing confidence in its longer-term positioning.
Caveats and Risks
- One strong week does not guarantee sustained inflows.
- Overall crypto market volumes remain relatively light, limiting the broader impact.
- Macro data (including upcoming inflation prints) can quickly alter institutional risk appetite.
- Concentration in a few products means future flows remain highly dependent on the largest issuers.
Moreover, while ETF inflows provide a clean window into institutional behaviour, they represent only one slice of total market activity.
As a result, on-chain metrics, derivatives positioning, and retail flows still require close monitoring.
Should Investors View This as a Turning Point?
The latest ETF data offers the clearest evidence in months that institutional demand for Bitcoin and Ethereum is improving.
The size and consistency of the inflows across five sessions support a constructive near-term interpretation.
On the other hand, the market remains sensitive to macroeconomic developments and regulatory headlines.
Therefore, any positioning decisions should still rest on disciplined risk management rather than a single weekly data point.
In addition, investors may reasonably treat the strong inflows as a positive confirmation signal while remaining prepared for potential volatility if macro conditions shift.

Frequently Asked Questions About Recent Bitcoin and Ethereum ETFs Inflows
How large were the exact inflows last week?
Spot Bitcoin ETFs attracted approximately $853–854 million, while spot Ethereum ETFs recorded about $245 million.
Meanwhile, the combined total reached roughly $1.1 billion, the strongest weekly combined result since April.
Which products attracted the most capital?
BlackRock’s IBIT dominated Bitcoin flows with more than 80% of the category total.
Furthermore, BlackRock’s Ethereum products similarly captured the large majority of ETH ETF inflows.
As a result, capital remains highly concentrated in the largest and most established vehicles.
Does this mean the crypto market has turned bullish?
Strong ETF inflows represent a constructive signal, yet they do not automatically confirm a full market recovery.
Thus, broader price action, volume, and macroeconomic data must still be considered alongside the flow figures.
Why did the inflows occur despite relatively low trading volumes?
Institutional ETF flows often move independently of retail-driven spot volume. Therefore, the rebound in regulated products can appear even while overall market activity remains subdued.
What should investors watch next?
The most important near-term catalysts include upcoming U.S. inflation data, continued daily ETF flow reports, and any shifts in broader risk sentiment.
In addition, the ability of inflows to persist beyond a single strong week will determine whether the current rebound gains lasting traction.
Final Perspective on the Strongest ETFs Week Since April
Spot Bitcoin and Ethereum ETFs have delivered their most robust weekly performance in nearly four months, attracting a combined $1.1 billion and reversing a quieter stretch of summer trading.
At the same time, the heavy concentration in BlackRock products and the still-moderate overall market volumes suggest a measured rather than euphoric return of institutional capital.
Thus, the data supports a cautiously constructive view while underscoring the need for continued discipline.
Meanwhile, investors who track these flows as a leading indicator of institutional positioning now have clearer evidence that demand for the two largest digital assets is improving.
In either case, sustained monitoring of daily flow data, macroeconomic releases, and broader market conditions remains essential.
Ultimately, strong ETF inflows provide valuable confirmation of institutional interest, yet they form only one piece of a larger market puzzle.
Always conduct independent research and never allocate capital based solely on a single week of flow data.
The second half of the crypto market looks promising. Only time will tell if the market will soar back to its previous highs.
