

BTC long-term holders just wrote a new chapter in market history.
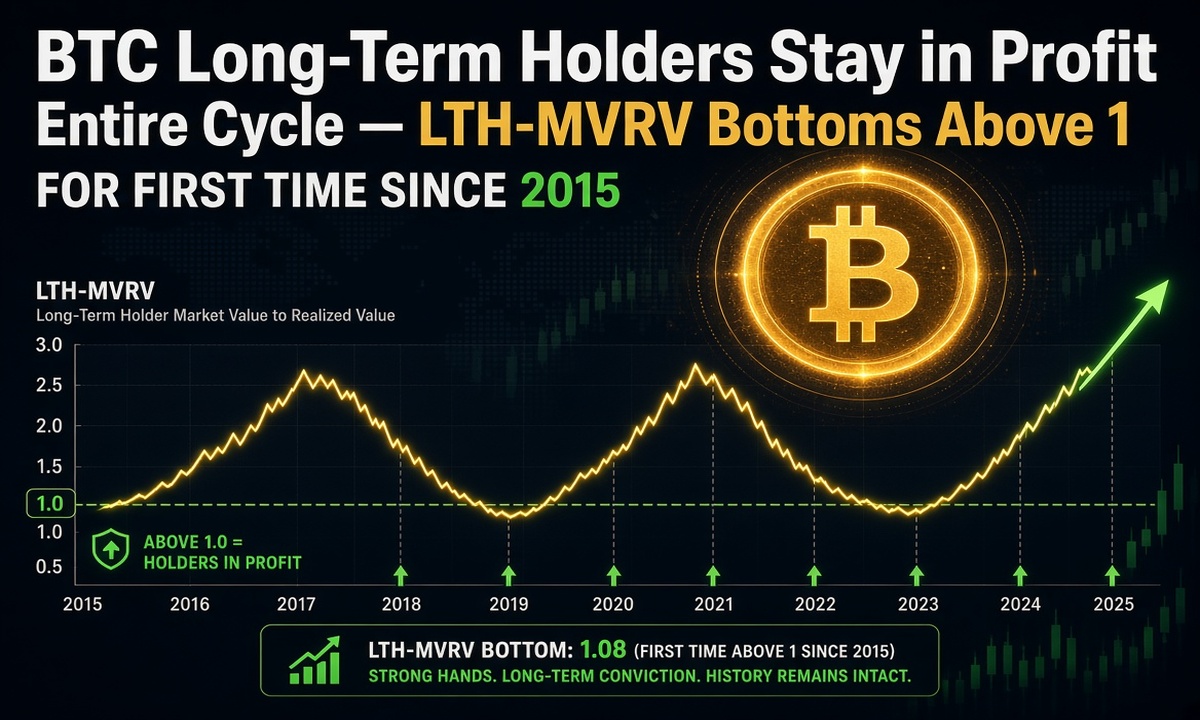
Glassnode data shows the LTH-MVRV ratio never dipped below 1 throughout the current cycle.
That means BTC Long-Term Holders stayed in aggregate profit the whole way down and back up again.
No previous bear market since at least 2015 managed the same feat.
In every earlier downturn, the metric fell below the break-even line at the cycle low, leaving even the strongest hands underwater.
This time, the floor held, and the ratio has already started climbing once more.

What Does LTH-MVRV Actually Measure for BTC Long-Term Holders?
LTH-MVRV compares the current market value of coins held longer than 155 days against the average price those holders originally paid.
A reading above 1 means the cohort sits in unrealised profit. A drop below 1 signals the average long-term holder is now underwater.
Glassnode’s chart makes the difference plain: earlier cycle lows painted the metric blue (loss territory). The latest trough stayed orange (profit territory) and has turned higher.

Why Has This Cycle Kept BTC Long-Term Holders in the Green?
Several structural shifts changed the game. Institutional demand through spot ETFs (exchange-traded funds) raised the average cost basis of the long-term cohort.
Many of those buyers simply refuse to sell into weakness. At the same time, the sheer size of coins that have not moved for years creates a higher structural floor.
Meanwhile, the absence of widespread forced selling from long-term wallets reduced the cascade that usually drives LTH-MVRV under 1.
The metric therefore bottomed above the critical threshold and is now recovering.

How Does This Compare with Previous Bear Markets?
Let us analyse 2015, 2018–2019 and 2022. Each time LTH-MVRV sliced cleanly below 1 near the price bottom.
Those periods coincided with deep capitulation and the eventual exhaustion of sellers.
In contrast, the current cycle produced only a shallow test that never crossed into loss territory for the long-term group.
The metric held the line and has already begun its ascent. That divergence marks the first such outcome in more than a decade. 
What Does a Floor Above 1 Signal for Future Price Action?
History suggests that when LTH-MVRV exits stress while still above break-even, the path of least resistance often turns higher.
Fewer long-term holders feel the psychological pressure to sell at the lows, which can tighten supply and support a more durable recovery.
At the same time, the current reading leaves plenty of room before the metric reaches the elevated levels that have previously marked cycle tops.
The combination of a higher floor and measured recovery gives the market a different character from past bears.

Are BTC Long-Term Holders Behaving Differently This Time?
Yes, the cohort now includes a larger share of institutional and ETF-driven capital that treats Bitcoin as a long-duration asset rather than a short-term trade.
Those holders tend to sit through volatility instead of panic-selling.
In addition, the coins that have remained dormant for years continue to anchor the realised price higher than in previous cycles.
Together, these factors helped keep the average long-term holder in profit even at the recent low.
The picture is clear: BTC long-term holders never went underwater this cycle, and LTH-MVRV has already begun to rise from a floor above 1.
That single fact separates the present market from every bear since 2015 and offers a fresh lens on supply dynamics going forward.
