

Token Terminal data reveals a striking shift in ownership patterns across tokenized assets.
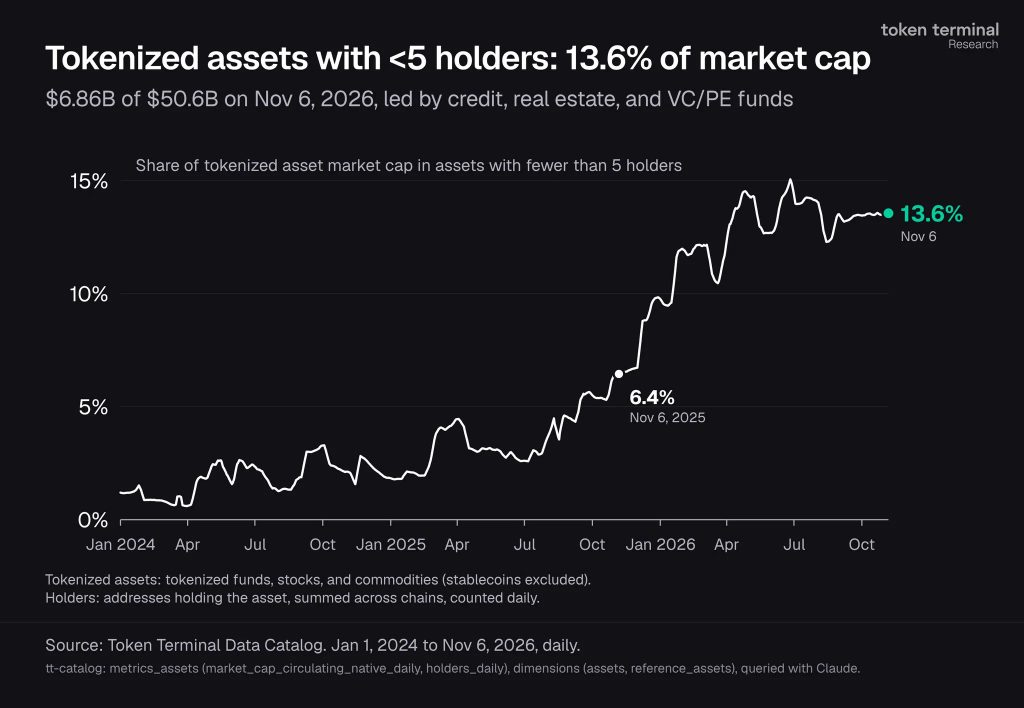
Fully 13.6% of the $50.6 billion market now sits inside assets held by fewer than five wallets.
That share equals $6.86 billion and has more than doubled from 6.4% one year earlier.
Credit instruments, real estate products, and VC/PE funds lead this closely held group.
The numbers exclude stablecoins and focus on tokenized funds, stocks, and commodities.
The trend chart climbs steadily after mid-2025 and holds near the current level through early November 2026.
What Does Concentration in Tokenized Assets Actually Signal?
A rising share of value locked in assets with tiny holder counts points to institutional preference rather than broad retail participation.
Issuers create vehicles that a handful of large wallets can absorb quickly.
Settlement happens onchain, yet ownership remains narrow.
The rails advance faster than the buyer base expands.
Credit, real estate, and private equity structures fit this pattern especially well.
These products often target qualified investors and carry higher minimums or eligibility rules.
Public tokenized stocks, by comparison, usually attract wider holder bases.
Why Has the Share of Closely Held Tokenized Assets Grown So Quickly?
Large managers prefer controlled distribution at first.
They list share classes onchain, transfer them to a small set of custody or platform wallets, and expand later.
Speed and cost advantages of blockchain settlement attract them even when the holder list stays short.
Meanwhile, the absolute size of the overall market keeps rising, so the concentrated slice grows in both percentage and dollar terms.
The year-over-year (YoY) jump from 6.4% to 13.6% shows the pattern accelerating rather than fading.
New credit and private-market products continue to arrive in this format.

How Does This Ownership Pattern Affect Liquidity and Access?
Assets held by only a few wallets usually show limited secondary trading.
Transfer activity stays low until the issuer opens the door wider.
Retail or smaller institutional buyers therefore face higher barriers.
At the same time, the infrastructure itself improves. Instant settlement and transparent ownership records still function even when the holder count stays low.
The market currently looks more like a collection of private group chats with modern rails than a fully open marketplace.
That stage often precedes broader distribution once regulatory clarity and secondary platforms mature.

Which Categories Drive the Closely Held Segment of Tokenized Assets?
Credit products sit near the top of the concentration ranking.
Real estate tokens and VC/PE fund shares follow closely.
These categories historically favour professional investors and longer holding periods.
Public equity tokens and some commodity products tend to distribute more widely, yet their share of total value remains smaller in the concentrated bucket.
Token Terminal’s daily holder counts, summed across chains, supply the underlying data.
The metric captures native circulating market cap and unique addresses holding each asset.

What Should Market Participants Watch Next?
The key question is whether the concentrated share stabilises or keeps climbing.
Further issuance of private-credit and real-estate products would push the percentage higher.
Conversely, successful retail or mid-market launches of the same categories could reverse the trend.
Secondary liquidity venues and clearer eligibility frameworks will also shape the outcome.
The data shows a simple reality. Tokenization currently serves institutional capital formation extremely well.
Broader ownership remains a later-stage goal rather than the present reality for a meaningful slice of the market.
