

Michael Saylor just gave the market a clearer picture of risk across the digital asset stack.
In a post on Saturday, September 26, 2026, the Strategy founder labelled $STRC as Digital Credit, $IBIT as Digital Capital, and $MSTR as Digital Equity.
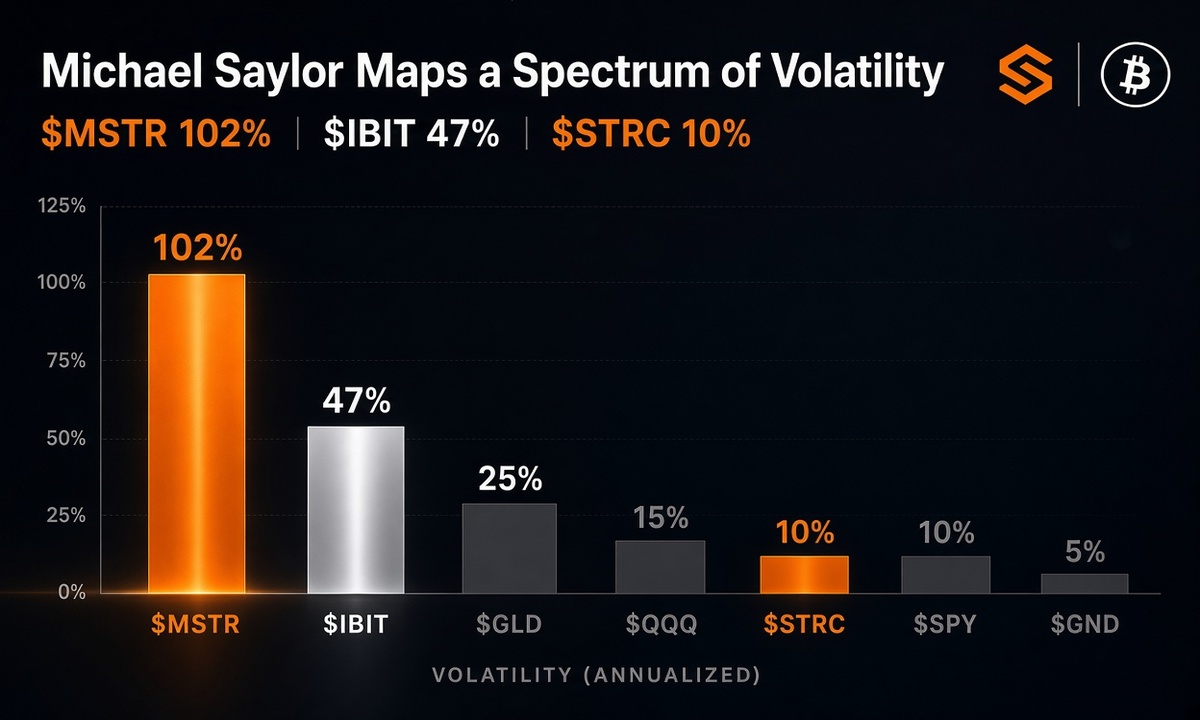
Meanwhile, he shared a fresh chart that puts hard numbers behind the labels.
Furthermore, the data reveals a sharp contrast in how these instruments behave.
What Does the New Volatility Chart Show?
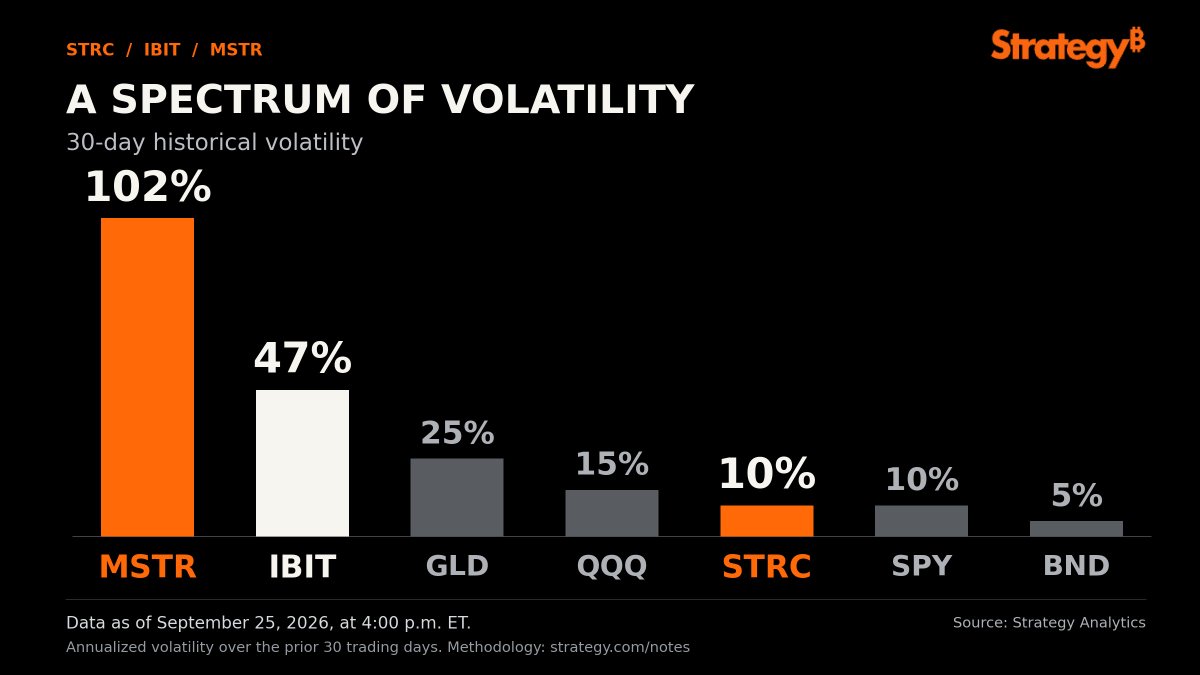
Strategy Analytics published 30-day historical volatility figures as of Friday, September 25, 2026.
In addition, the chart ranks $MSTR at a striking 102 percent, while $IBIT sits at 47 percent.
Notably, $STRC registers only 10 percent, matching the S&P 500 and sitting far closer to traditional bonds than to Bitcoin-linked equities.
Beyond that, gold (GLD) comes in at 25 percent and the Nasdaq-100 (QQQ) at 15 percent, creating a clear descending ladder of risk.
Why Does Michael Saylor Call $MSTR Digital Equity?
$MSTR continues to function as a leveraged vehicle for Bitcoin exposure through a public company structure.
At the same time, its 102% volatility reflects both Bitcoin’s moves and the additional leverage embedded in Strategy’s treasury approach.
Moreover, Saylor’s “Digital Equity” label positions the stock as ownership of a Bitcoin-centric business rather than a passive tracker.
Interestingly, that high volatility is the price investors pay for the amplified upside the strategy has historically delivered.

How Does $STRC Fit as Digital Credit?
The 10% volatility reading places $STRC in a completely different risk category.
In particular, it trades in line with broad equity indexes and only modestly above bond funds.
On top of that, the “Digital Credit” framing suggests the product aims to offer more stable, yield-oriented exposure within the Bitcoin ecosystem.
Subsequently, the chart supports the idea that Strategy is building instruments for investors who want Bitcoin-related returns without the extreme swings of $MSTR.

Where Does $IBIT Sit in the Michael Saylor Chart?
BlackRock’s $IBIT delivers straightforward Bitcoin price exposure with 47% volatility.
In the meantime, Saylor’s “Digital Capital” description keeps the exchange-traded fund (ETF) in its natural role as pure asset ownership.
Similarly, the middle position on the volatility spectrum makes it a bridge between high-octane equity plays and lower-risk credit products.
Saylor’s post and accompanying chart together offer a practical framework.
Investors can now see not only the conceptual roles of these instruments but also the real differences in how much the prices actually move.
The numbers make the hierarchy harder to ignore.
