


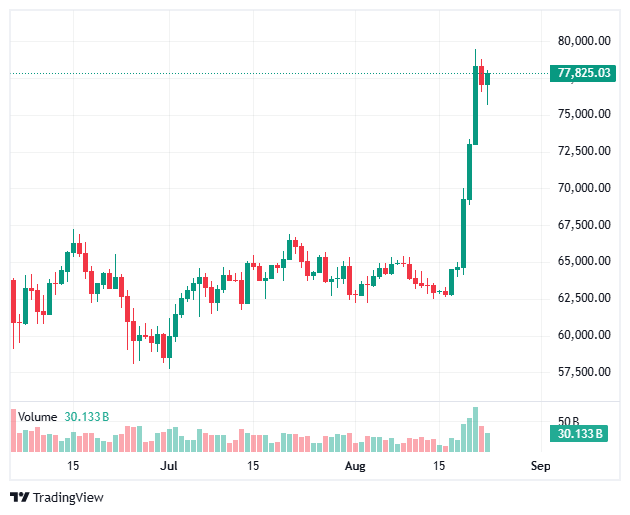
Bitcoin trades near $77,000 on August 23, 2026, after a powerful weekly advance that carried it from the mid-$60,000s toward peaks close to $79,500.
Traders now focus on precise price zones that can either sustain the recovery or invite a deeper pullback.
This analysis draws from recent technical observations, on-chain distribution data, and market structure to identify the levels that matter most.
What are the nearest resistance levels for Bitcoin?
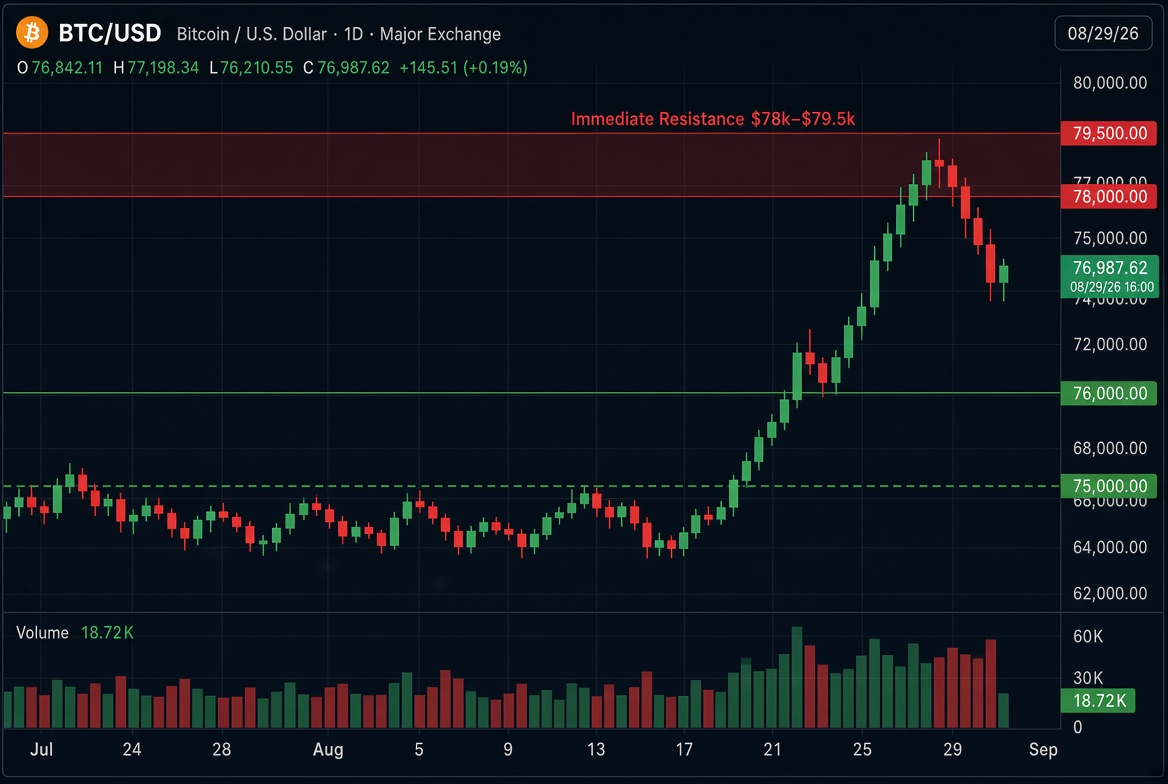
Bitcoin faces immediate overhead pressure in the $78,000–$79,500 band. Recent intraday highs and short-term supply clusters sit inside this zone. A clear daily close above the upper edge of that range would strengthen bullish momentum.
Furthermore, the psychological $80,000 mark stands just beyond the recent highs. Many participants treat this round number as a natural barrier.
Meanwhile, on-chain metrics highlight a denser supply area between roughly $83,000 and $84,500, where approximately one million Bitcoin previously changed hands.
Higher targets near $85,000 appear on some short-term projections once the market clears the $80,000 threshold.
Where does Bitcoin find its strongest near-term support?
Immediate demand sits around $76,000–$76,500. This zone overlaps recent consolidation lows and short-term breakout retest areas.
Holding here keeps the sequence of higher lows intact after the sharp weekly climb.
In addition, the broader $75,000–$76,000 region acts as a primary pivot. Market participants view sustained trading above this band as confirmation that the breakout structure remains valid.
Likewise, a deeper support shelf appears near $73,500–$74,500. That area marks the origin of the most recent leg higher and former resistance that flipped into potential demand.
How do longer-term levels influence Bitcoin’s structure?
Bitcoin still references the prior multi-week range that contained price between roughly $62,000 and $67,000. A return toward $70,000–$71,700 would test the integrity of the recovery.
Some analysts flag the $69,000–$70,000 zone as an important defence area where additional long liquidation risk could surface.
Simultaneously, major moving averages and historical volume nodes continue to shape the wider picture.
Price reclaimed several shorter-term averages during the rally, yet longer-term averages still cluster near the upper end of the current range and reinforce resistance higher up.
Why do these Bitcoin levels matter for traders right now?
Support and resistance zones guide risk management and entry decisions. A firm hold above $75,000–$76,000 preserves the bullish short-term structure that developed this week.
Conversely, a decisive break below $74,000 would shift attention toward the $70,000–$71,700 region and raise the odds of a deeper consolidation.
Moreover, resistance near $80,000 remains the clearest near-term hurdle. Clearing that level with conviction would open the path toward the $83,000–$85,000 supply zone.
Traders monitoring volume, ETF flow data, and weekend spot demand will watch these boundaries closely for confirmation or rejection signals.
Bitcoin’s current map places the immediate battle between $76,000 support and $80,000 resistance.
The next sessions will reveal whether buyers defend the recent gains or whether profit-taking returns price toward lower shelves.
Market structure continues to evolve rapidly, and these levels offer the clearest reference points available today.

1 Comment
Really valuable information, thanks for posting this.