


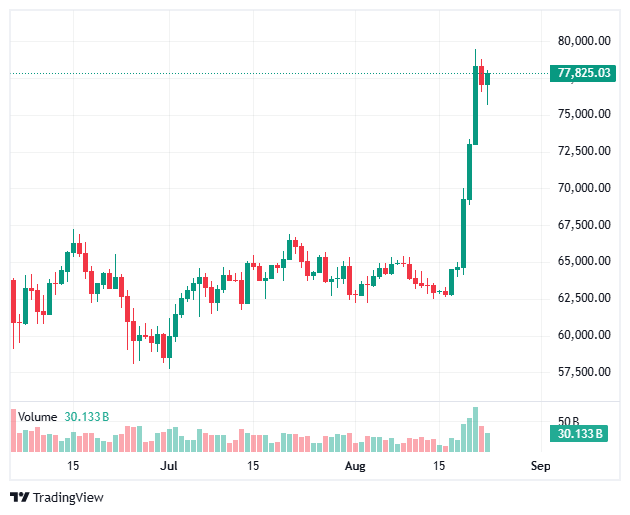
Bitcoin climbed more than 20 percent in a single week during late August 2026, advancing from the mid-$60,000 range toward peaks near $79,500 before settling near $77,000.
Traders watched the move unfold with unusual speed. Multiple forces arrived together and reinforced one another.
This article examines those forces with fresh detail drawn from market data and analyst observations.
What triggered Bitcoin’s sharp rise this week?
Bitcoin broke out of a six-week range that had held it between roughly $62,000 and $67,000.
The first catalyst arrived from outside crypto markets. The U.S. Treasury announced it would at least double the size of its liquidity-support buybacks of longer-dated bonds, lifting the per-operation limit from $2 billion to at least $4 billion starting in early September.
Long-term yields eased after the announcement which led to risk assets such as Bitcoin gaining the much-needed support in the financial markets. Evidently, BTC responded first among scarce, non-yielding assets.
Meanwhile, leveraged traders who had built large short positions inside the prior range faced immediate pressure.
Once price cleared key levels, exchanges began liquidating under-collateralised shorts. Forced buying accelerated the advance.
In addition, U.S. spot Bitcoin ETFs recorded their strongest weekly inflows of 2026, with figures near $1.6 billion across several sessions and single-day peaks above $600 million.
Regulatory signals from Washington added further tailwinds. Each element amplified the others rather than acting alone.

How did ETF inflows support the Bitcoin surge?
Spot Bitcoin ETFs shifted from earlier periods of net outflows to a clear rebound. Data tracked by market observers showed consecutive days of strong buying, led by products such as BlackRock’s IBIT.
Institutional desks placed real capital into the funds. Those purchases created steady demand that absorbed supply and reduced the chance of a quick reversal after the initial squeeze.
Furthermore, the scale of the inflows stood out against the quiet summer trading environment that preceded the breakout.
Analysts at firms including Bernstein noted that the returning ETF demand, combined with improving liquidity conditions, helped transform a technical bounce into broader momentum.
Likewise, the funds’ combined assets under management climbed higher, reinforcing the institutional bid.
What role did the short squeeze play in Bitcoin’s climb?
Crowded short positioning had accumulated during the prior range-bound weeks. When Bitcoin pierced the upper boundary of that range, liquidations cascaded.
Reports citing CoinGlass data placed total short liquidations across crypto in the multi-billion-dollar range, with Bitcoin accounting for a substantial share—figures cited between $1.4 billion and higher in the most intense sessions.
Simultaneously, forced covering generated market-buy orders that pushed price into the next cluster of stops. The feedback loop intensified the move.
Nevertheless, several analysts emphasised that the squeeze acted as an accelerator rather than the sole driver.
Spot and ETF demand continued after the heaviest liquidations faded, suggesting underlying interest beyond pure positioning.

How does the U.S. Treasury action affect Bitcoin?
The Treasury’s decision to expand longer-dated buybacks lowered yields at the long end of the curve and injected perceived liquidity support into the financial system.
Lower long-term rates historically reduce the opportunity cost of holding non-yielding assets.
Bitcoin, widely viewed by some investors as a scarce digital alternative, benefited from that shift.
In parallel, the announcement arrived after a period of elevated long-end yields that had pressured risk assets.
Markets interpreted the move as a signal of willingness to manage duration and liquidity. Bitcoin, trading continuously, absorbed the sentiment quickly.
Importantly, the policy change did not constitute formal quantitative easing, yet its timing aligned with the sharpest price gains of the week.
Can Bitcoin sustain this momentum?
The rally combined a liquidity impulse, forced covering, renewed ETF demand, and regulatory optimism in a short window.
Short-term technical indicators reached overbought levels, and weekend trading removed the ETF channel, testing pure spot demand.
Key resistance remains near the $80,000 psychological zone, while earlier support levels around $70,000–$74,000 now attract attention.
Moreover, the durability of the advance will depend on whether ETF inflows continue after the initial rebound and whether macro conditions remain supportive.
Analysts have noted that squeezes often initiate moves, yet sustained progress requires ongoing demand.
Regulatory developments, including progress on market-structure legislation, could provide additional catalysts.
Conversely, any sharp reversal in yields or broader risk sentiment would test the new higher levels.
Bitcoin’s recent advance stands out for the convergence of macro liquidity signals, positioning dynamics, institutional flows, and policy headlines within days.
Observers continue to monitor whether the combination evolves into a longer trend or consolidates after the initial surge.
Market participants tracking price action, ETF data, and Treasury operations will find the next sessions particularly informative.
As always, the crypto market is highly volatile. Bitcoin was down for sometime but it looks like the bulls could return once again.
This is the reason why analysts at CryptoGuide continue to urge crypto traders that having absolute time in this highly volatile environment is better than trying to time the entire market.
Invest in Bitcoin and other cryptocurrencies an amount you can consider as bad debt.
