


Wall Street just delivered one of its clearest votes of confidence in digital assets this year with the performance of Bitcoin ETFs.
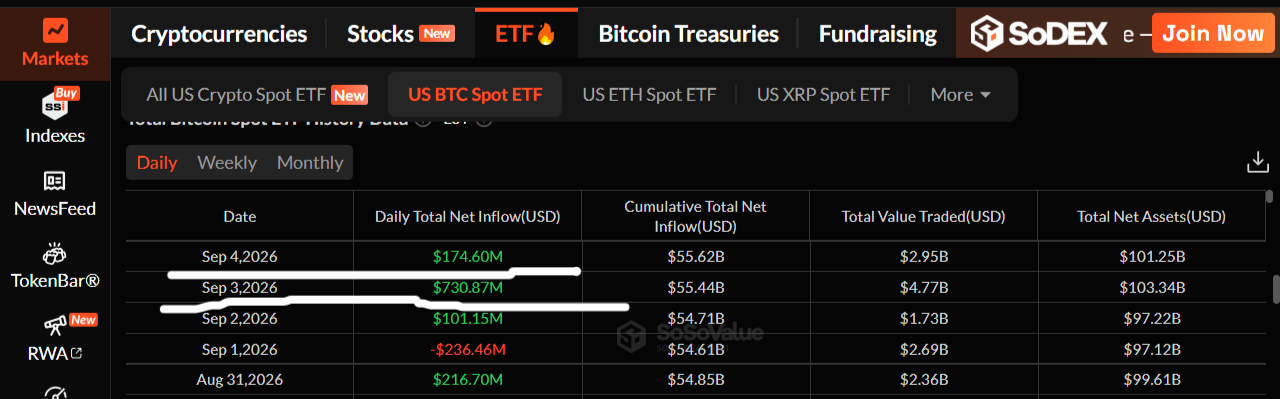
On September 3, 2026, U.S. spot Bitcoin ETFs absorbed roughly $731 million in net inflows during a single trading session.
That figure stands as the strongest daily haul since mid-January and marks a sharp turnaround after earlier volatility.
BlackRock’s iShares Bitcoin Trust (IBIT) led the charge, pulling in the bulk of the capital while Bitcoin itself reclaimed levels above $80,000.
Institutional money is moving with purpose, and the implications stretch far beyond one strong day.
This article examines the forces behind the surge, breaks down the mechanics of Bitcoin ETFs, and explores what the flows signal for price action and longer-term market structure.
Every section draws on verified flow data and market context so readers gain a clear, grounded view of the current landscape.
What Caused the $731 Million Bitcoin ETF Inflows / Why Did They Spike on That Day?
Fed Governor Christopher Waller provided the clearest spark.
He indicated a willingness to keep interest rates unchanged at the upcoming September meeting provided inflation continues cooling.
Markets interpreted the remarks as a green light for risk assets.
Equity indexes advanced, Treasury yields eased, and Bitcoin climbed back through the $80,000 level.
Bitcoin ETFs responded almost immediately as fresh capital entered the products.
August already showed building momentum. Spot Bitcoin ETFs posted solid monthly inflows, creating residual demand that carried into early September.
A prior session of outflows on September 1 left room for a rebound once the macro tone improved.
Institutional desks, sensing reduced rate-hike pressure, allocated size through the most liquid vehicles available.
Bitcoin ETFs therefore captured the shift faster than many other asset classes.
The combination of dovish policy signals, price recovery, and existing institutional positioning produced the $731 million day.
Analysts tracking the data noted that the concentration of flows pointed to deliberate allocation rather than short-term speculation.
How Much Did BlackRock’s IBIT Specifically Take In, and Why Does It Dominate These Inflows?
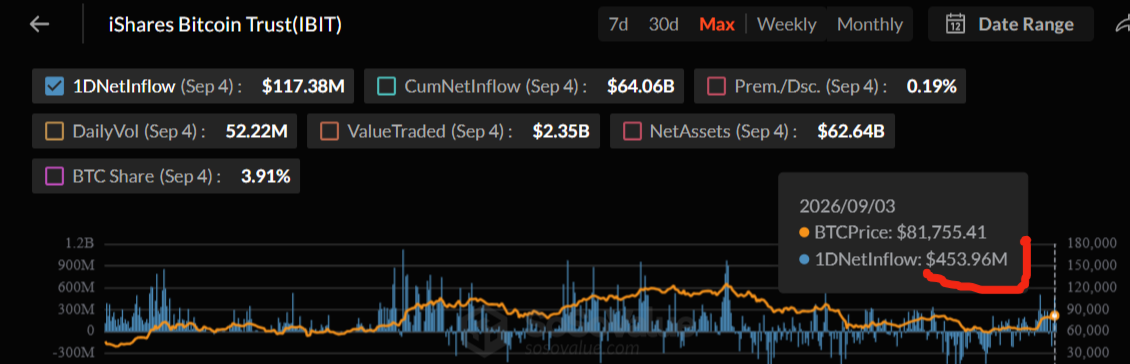
BlackRock’s IBIT alone secured approximately $454 million, or more than 60 percent of the session’s total.
ARK 21Shares’ ARKB followed with roughly $138 million, while Fidelity’s FBTC added about $74 million.
Smaller funds recorded mixed results, with a few seeing modest outflows.
IBIT dominates for structural reasons. BlackRock operates the largest distribution network in asset management and offers deep liquidity that large institutions require for sizeable orders.
Portfolio managers can execute multi-hundred-million-dollar tickets with limited slippage.
The fund’s tight spreads and established custody arrangements further reinforce its status as the default institutional wrapper.
Over successive strong inflow days, IBIT consistently captures the majority share, reflecting both brand trust and operational scale.
This leadership pattern has persisted since the products launched.
When capital moves aggressively into Bitcoin ETFs, IBIT usually absorbs the largest portion.
What Do Bitcoin ETF Inflows (or Net Inflows) Actually Mean, and How Do They Work?
Net inflows measure the difference between money entering and leaving the funds on a given day.
When demand for ETF shares rises, authorised participants create new shares.
Those participants deliver actual Bitcoin (or cash that the fund uses to purchase Bitcoin) to the issuer.
The newly created shares then trade on the secondary market.
The reverse process occurs during outflows: shares are redeemed and Bitcoin leaves the fund’s custody.
Secondary-market trading of existing shares does not change the fund’s Bitcoin holdings.
Only creations and redemptions alter the underlying supply locked inside the ETFs.
Because most U.S. spot Bitcoin ETFs hold physical Bitcoin in regulated custody, each dollar of net inflow corresponds to Bitcoin removed from the circulating exchange supply.
That absorption mechanism gives the flow data real economic weight.
Daily flow figures therefore serve as one of the cleanest real-time gauges of institutional demand flowing through traditional financial rails.
What Does This Mean for Bitcoin’s Price / Will (or Did) the Bitcoin ETFs Inflows Push BTC Higher?
The $731 million session coincided with Bitcoin’s move above $80,000 and a brief push toward $82,000.
ETF buying removes coins from the open market and places them into long-term custody. That supply reduction supports price when demand is rising.
On this particular day the inflows reinforced an existing recovery that had already begun after Waller’s comments and short-covering activity.
Sustained inflows over multiple sessions tend to exert more lasting pressure than any single print.
Historical patterns show that periods of consistent positive flows have aligned with upward price trends, while heavy outflow stretches have coincided with weakness.
One strong day alone rarely dictates direction; the cumulative effect matters more.
Bitcoin’s ability to hold gains after the September 3 flows will depend on whether subsequent sessions continue attracting capital and whether macro data remain supportive.

Is This the Largest/Record Bitcoin ETFs Inflow Ever, and How Does It Compare to Previous Highs or Cumulative Totals?
The $731 million total ranks as the strongest single day since January 14, 2026, when the funds attracted roughly $843 million.
It does not set an all-time record. Earlier sessions in 2024 produced higher daily figures.
Still, the September print stands out because it arrived after a stretch of more muted activity and reversed a notable outflow day earlier in the week.
Cumulative net inflows since the January 2024 launch now exceed $55 billion.
Combined assets under management across the U.S. spot Bitcoin ETFs surpassed $103 billion following the latest session, representing more than 6 percent of Bitcoin’s total market capitalisation.
Those figures illustrate how quickly the products have scaled and how significant a role they now play in overall market structure.
Broader Market Context and Institutional Positioning
Beyond the headline number, the composition of flows reveals institutional preference for scale and liquidity.
Large asset managers continue routing the majority of new capital through the biggest funds.
This concentration streamlines execution yet also concentrates influence.
When IBIT experiences heavy creations, the underlying Bitcoin market feels the demand quickly.
August’s solid monthly performance provided a foundation.
The early-September rebound then amplified that trend once policy uncertainty eased.
Corporate treasury buyers and other long-term holders have also remained active, adding a steady layer of demand that complements the ETF channel.

Bitcoin ETFs: What Investors Should Watch
Future flow data will show whether the September 3 session marked the start of a sustained allocation wave or a temporary response to one set of policy comments.
Upcoming inflation reports and the mid-September FOMC meeting stand as the next major catalysts.
Continued positive net inflows would reinforce the structural demand story for Bitcoin ETFs.
Any sharp reversal would signal that institutions remain sensitive to shifting rate expectations.
The products have already demonstrated their capacity to move meaningful capital and absorb supply.
Their growing share of total Bitcoin ownership continues to reshape how traditional finance interacts with the asset.
Bitcoin ETFs now function as a primary bridge between Wall Street capital and the Bitcoin market.
The $731 million day offers a clear snapshot of that bridge in action—large, concentrated, and highly responsive to macroeconomic signals.
